Python 中的曲线拟合(附示例)
通常,您可能希望在 Python 中将曲线拟合到数据集。

以下分步示例说明了如何使用numpy.polyfit()函数在 Python 中将曲线拟合到数据,以及如何确定哪条曲线最适合数据。
第 1 步:创建数据并可视化
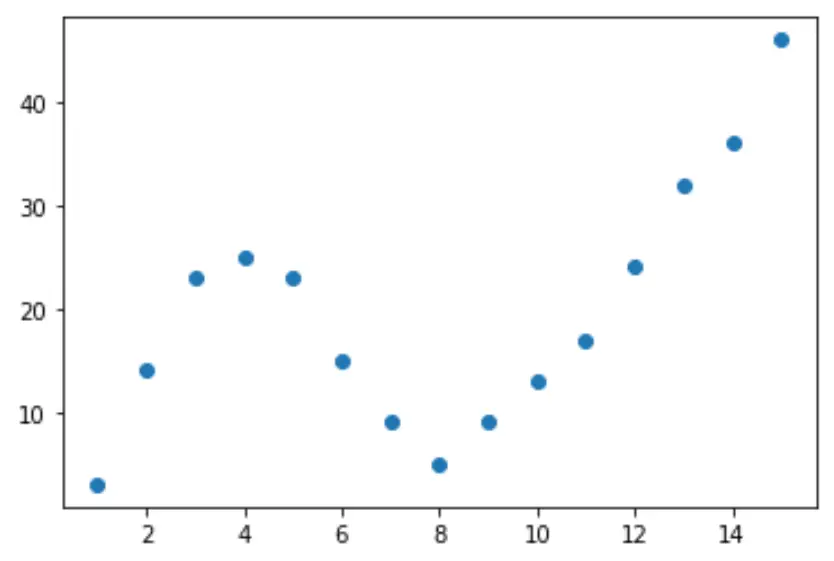
让我们首先创建一个假数据集,然后创建一个散点图来可视化数据:
 import pandas as pd
import matplotlib. pyplot as plt

#createDataFrame
df = pd. DataFrame ({' x ': [1, 2, 3, 4, 5, 6, 7, 8, 9, 10, 11, 12, 13, 14, 15],
                   ' y ': [3, 14, 23, 25, 23, 15, 9, 5, 9, 13, 17, 24, 32, 36, 46]})

#create scatterplot of x vs. y
plt. scatter (df. x , df. y )

第2步:调整多条曲线
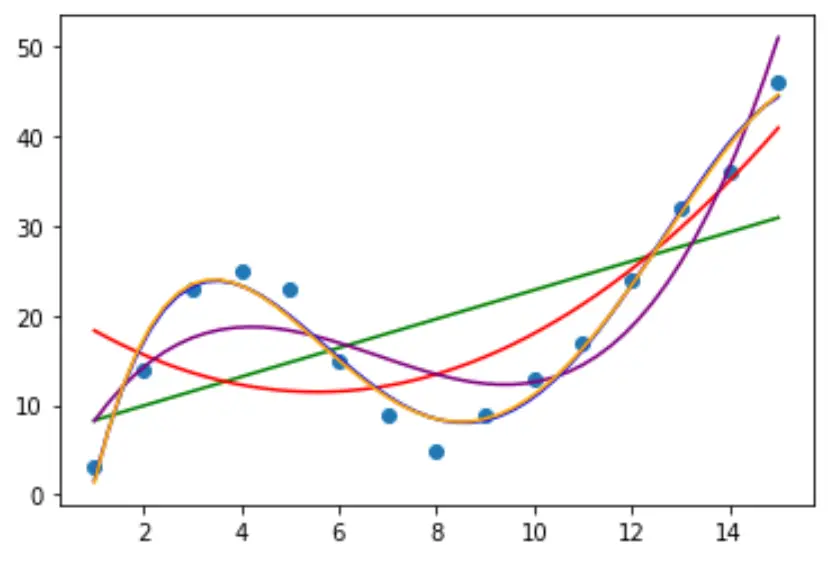
然后,让我们将几个多项式回归模型拟合到数据,并在同一图中可视化每个模型的曲线:
 import numpy as np

#fit polynomial models up to degree 5
model1 = np. poly1d (np. polyfit (df. x , df. y , 1))
model2 = np. poly1d (np. polyfit (df. x , df. y , 2))
model3 = np. poly1d (np. polyfit (df. x , df. y , 3))
model4 = np. poly1d (np. polyfit (df. x , df. y , 4))
model5 = np. poly1d (np. polyfit (df. x , df. y , 5))

#create scatterplot
polyline = np. linspace (1, 15, 50)
plt. scatter (df. x , df. y )

#add fitted polynomial lines to scatterplot
plt. plot (polyline, model1(polyline), color=' green ')
plt. plot (polyline, model2(polyline), color=' red ')
plt. plot (polyline, model3(polyline), color=' purple ')
plt. plot (polyline, model4(polyline), color=' blue ')
plt. plot (polyline, model5(polyline), color=' orange ')
plt. show ()

为了确定哪条曲线最适合数据,我们可以查看每个模型的调整后的 R 方。
该值告诉我们可以由模型中的预测变量解释的响应变量的变化百分比,并根据预测变量的数量进行调整。
 #define function to calculate adjusted r-squared
def adjR(x, y, degree):
    results = {}
    coeffs = np. polyfit (x, y, degree)
    p = np. poly1d (coeffs)
    yhat = p(x)
    ybar = np. sum (y)/len(y)
    ssreg = np. sum ((yhat-ybar)**2)
    sstot = np. sum ((y - ybar)**2)
    results[' r_squared '] = 1- (((1-(ssreg/sstot))*(len(y)-1))/(len(y)-degree-1))

    return results

#calculated adjusted R-squared of each model
adjR(df. x , df. y , 1)
adjR(df. x , df. y , 2)
adjR(df. x , df. y , 3)
adjR(df. x , df. y , 4)
adjR(df. x , df. y , 5)

{'r_squared': 0.3144819}
{'r_squared': 0.5186706}
{'r_squared': 0.7842864}
{'r_squared': 0.9590276}
{'r_squared': 0.9549709}
从结果中我们可以看到,调整 R 平方最高的模型是四次多项式,其调整 R 平方为0.959 。
第 3 步:可视化最终曲线
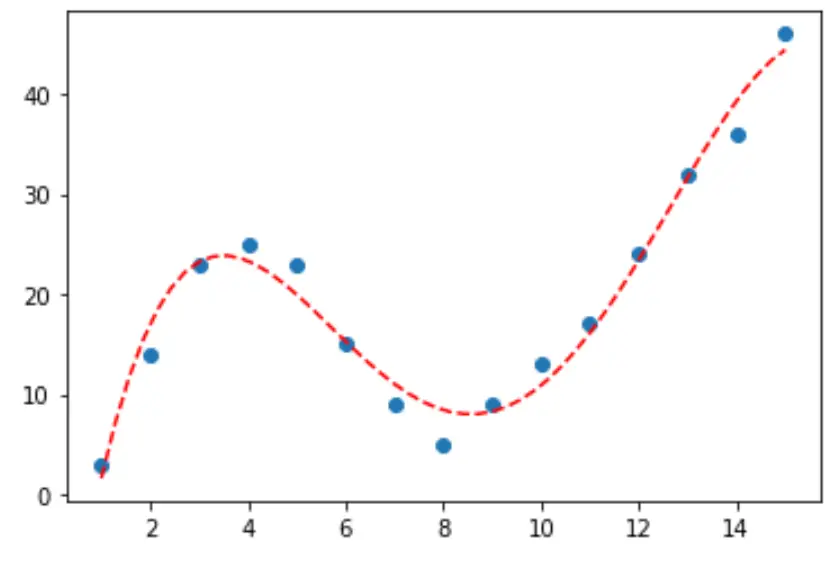
最后,我们可以用四次多项式模型的曲线创建散点图:
 #fit fourth-degree polynomial
model4 = np. poly1d (np. polyfit (df. x , df. y , 4))

#define scatterplot
polyline = np. linspace (1, 15, 50)
plt. scatter (df. x , df. y )

#add fitted polynomial curve to scatterplot
plt. plot (polyline, model4(polyline), ' -- ', color=' red ')
plt. show ()

我们还可以使用print()函数得到该行的方程:
 print (model4)

          4 3 2
-0.01924x + 0.7081x - 8.365x + 35.82x - 26.52
曲线方程如下:
y = -0.01924x 4 + 0.7081x 3 – 8.365x 2 + 35.82x – 26.52
我们可以使用该方程根据模型中的预测变量来预测响应变量的值。例如,如果x = 4 那么我们将预测y = 23.32 :
y = -0.0192(4) 4 + 0.7081(4) 3 – 8.365(4) 2 + 35.82(4) – 26.52 = 23.32