如何在 python 中向图表添加误差线
通常,您可能希望在 Python 中的图形中添加误差线,以捕获测量值或计算值的不确定性。幸运的是,使用 matplotlib 库可以轻松做到这一点。
本教程介绍如何在 Python 中向条形图和折线图添加误差线。
条形图中的误差线
假设我们在Python中有以下10个值的数据集:
 import numpy as np
import matplotlib.pyplot as plt

#define dataset
data = [4, 6, 6, 8, 9, 14, 16, 16, 17, 20]
要为此数据集创建带有误差线的条形图,我们可以将误差线的宽度设置为标准误差,其计算公式为
标准误差 = s / √n
金子:
- s:样本标准差
- n:样本量
以下代码显示了如何计算此示例的标准误差:
 #calculate standard error
std_error = np.std(data, ddof=1) / np.sqrt(len(data))

#view standard error
std_error

1.78
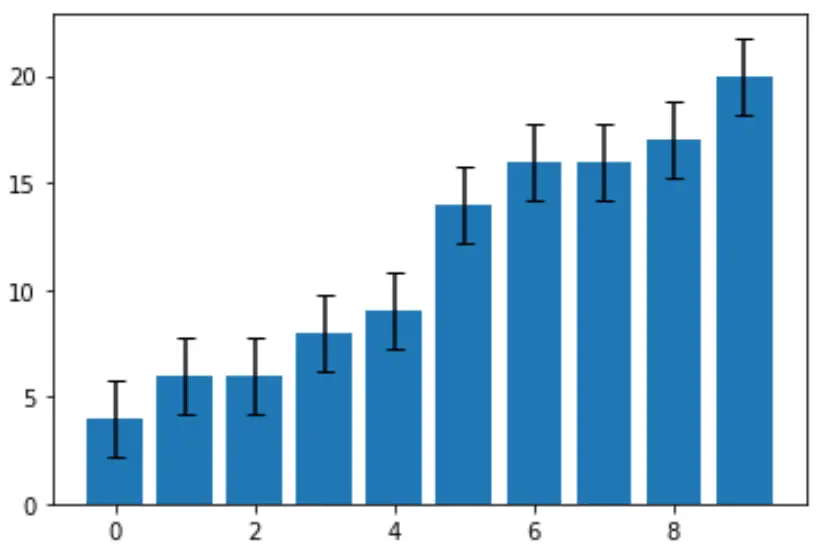
最后,我们可以使用宽度等于标准误差的误差条创建条形图:
 #define chart
fig, ax = plt.subplots()

#create chart
ax.bar(x=np.arange(len(data)), #x-coordinates of bars
       height=data, #height of bars
       yerr=std_error, #error bar width
       capsize=4) #length of error bar caps

标准误差结果为1.78 。这是从图表上的点估计值开始向任一方向延伸的误差条的宽度。例如,图表中第一个条形的值为 4,因此它的误差条延伸自:
- 下端:4 – 178 = 2.22
- 顶端:4 + 1.78 = 5.78
图表中的每个误差条的宽度相同。
折线图中的误差线
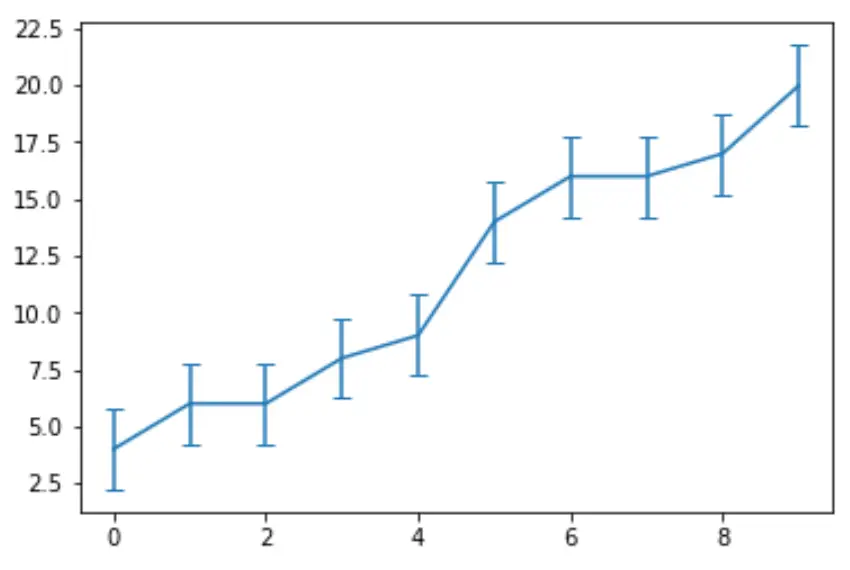
以下代码显示如何为同一数据集创建带有误差线的折线图:
 import numpy as np
import matplotlib.pyplot as plt

#define data
data = [4, 6, 6, 8, 9, 14, 16, 16, 17, 20]

#define x and y coordinates
x = np.arange(len(data))
y = data

#create line chart with error bars
fig, ax = plt.subplots()

ax.errorbar(x, y,
            yerr=std_error,
            capsize=4)

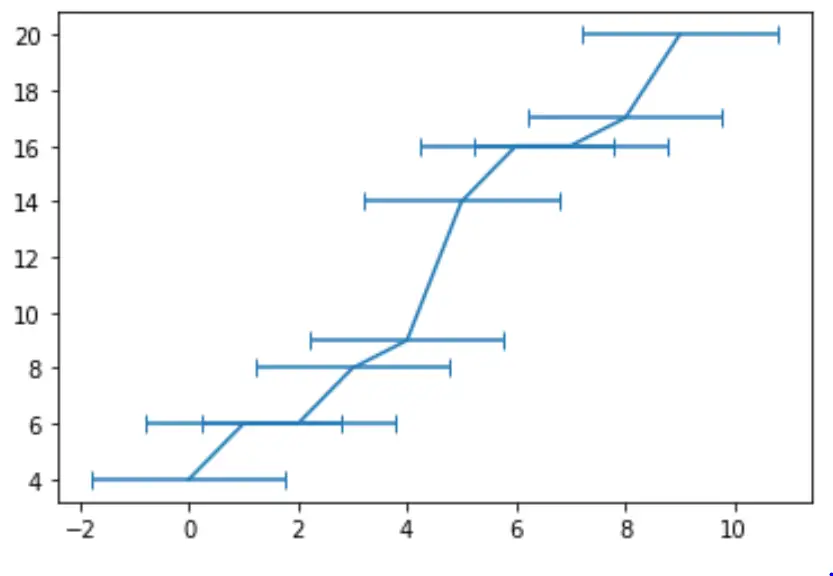
请注意, yerr参数告诉 Python 创建垂直误差线。我们可以使用xerr参数来使用水平竖线:
 #create line chart with horizontal error bars
fig, ax = plt.subplots()

ax.errorbar(x, y,
            xerr =std_error,
            capsize=4)

您可以在此处找到更多 Python 教程。