如何在 r 中创建森林图
森林图(有时称为“斑点图”)用于荟萃分析,以在单个图中可视化多项研究的结果。

茶
这种类型的图提供了一种同时查看多项研究结果的便捷方法。
以下示例展示了如何在 R 中创建森林图。
示例:R 中的森林图
要在 R 中创建森林图,我们首先需要创建一个数据框,其中包含每个研究的效应大小(或其他感兴趣的值)以及置信区间的上限和下限:
 #create data
df <- data. frame (study=c('S1', 'S2', 'S3', 'S4', 'S5', 'S6', 'S7'),
                 index=1:7,
                 effect=c(-.4, -.25, -.1, .1, .15, .2, .3),
                 lower=c(-.43, -.29, -.17, -.02, .04, .17, .27),
                 upper=c(-.37, -.21, -.03, .22, .24, .23, .33))

#view data
head(df)

  study index effect lower upper
1 S1 1 -0.40 -0.43 -0.37
2 S2 2 -0.25 -0.29 -0.21
3 S3 3 -0.10 -0.17 -0.03
4 S4 4 0.10 -0.02 0.22
5 S5 5 0.15 0.04 0.24
6 S6 6 0.20 0.17 0.23
7 S7 7 0.30 0.27 0.33
接下来,我们可以使用ggplot2数据可视化包的功能来创建以下森林图:
 #load ggplot2
library (ggplot2)

#create forest plot
ggplot(data=df, aes (y=index, x=effect, xmin=lower, xmax=upper)) +
  geom_point() +
  geom_errorbarh(height= .1 ) +
  scale_y_continuous(name = "", breaks=1: nrow (df), labels=df$study)

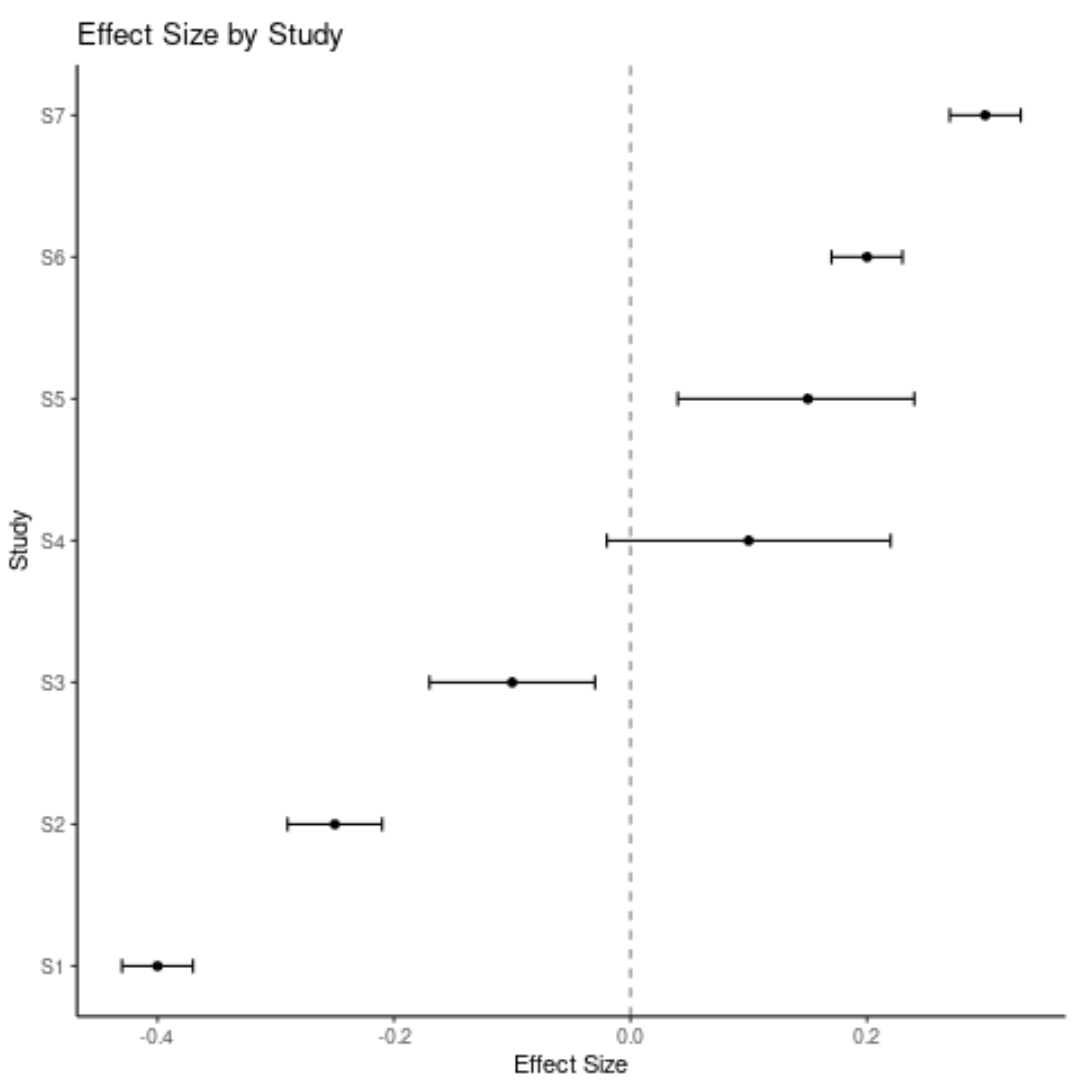
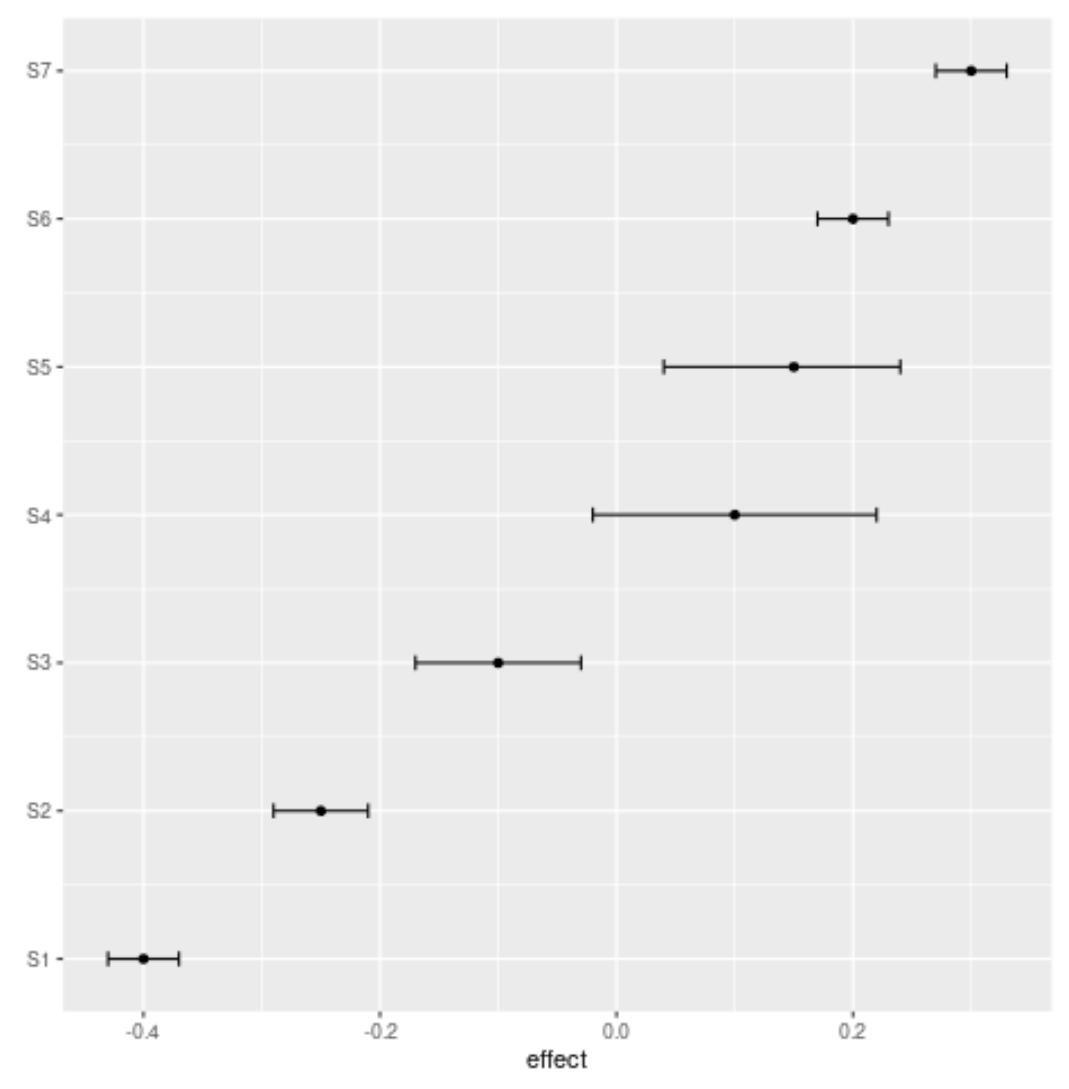
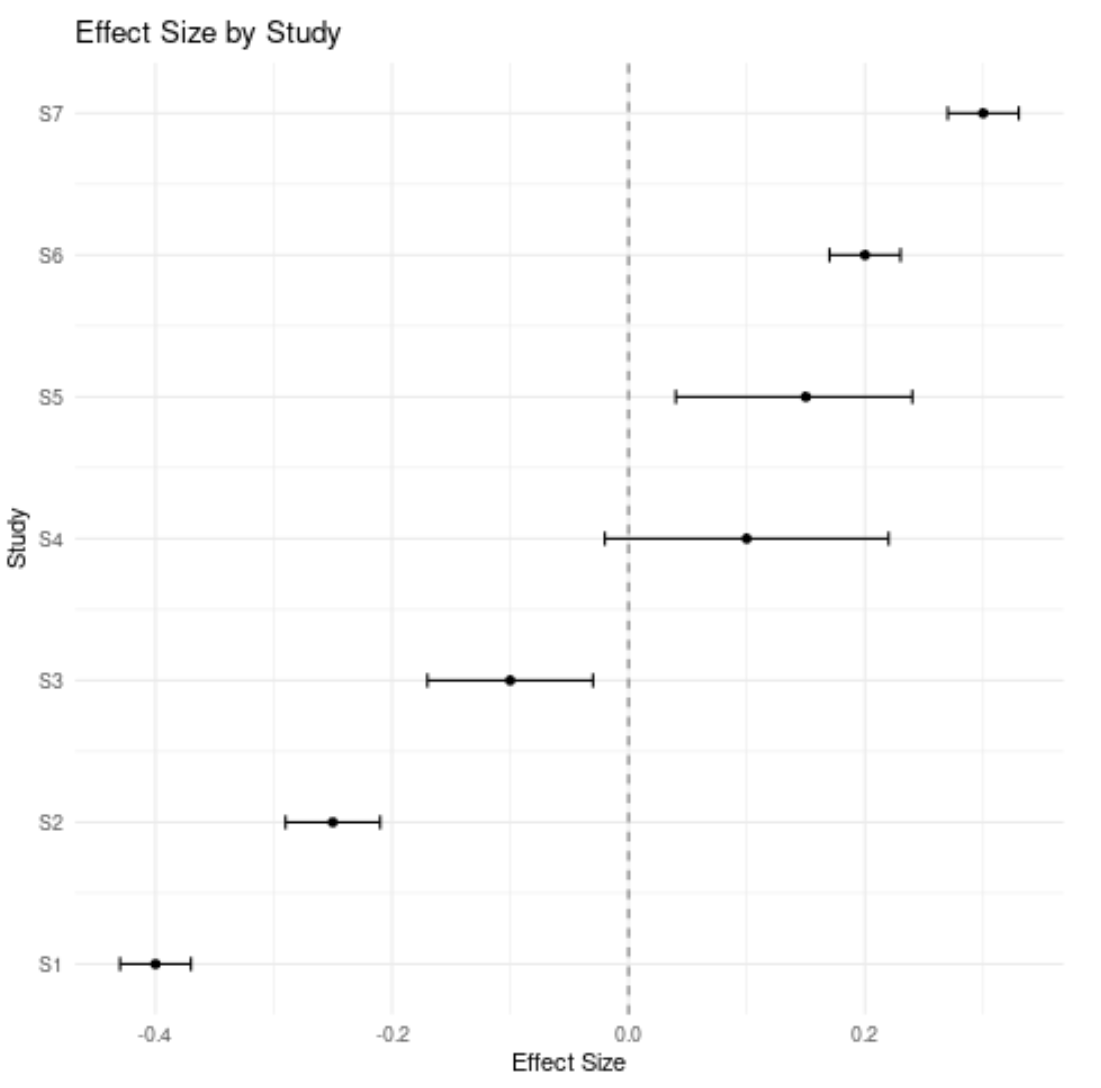
x 轴显示每个研究的效应大小,y 轴显示每个研究的名称。
图中的点显示每项研究的效应大小,误差线显示置信区间的限制。
请注意,我们还可以添加标题,更改轴标签,并添加效果大小为零的垂直线,以使图表看起来更好:
 #load ggplot2
library (ggplot2)

#create forest plot
ggplot(data=df, aes (y=index, x=effect, xmin=lower, xmax=upper)) +
  geom_point() +
  geom_errorbarh(height= .1 ) +
  scale_y_continuous(breaks=1: nrow (df), labels=df$study) +
  labs(title=' Effect Size by Study ', x=' Effect Size ', y = ' Study ') +
  geom_vline(xintercept=0, color=' black ', linetype=' dashed ', alpha= .5 ) +
  theme_minimal()

请随意更改情节主题,使其看起来像您想要的那样。例如,我们还可以使用theme_classic()来获得更经典的外观:
 #load ggplot2
library (ggplot2)

#create forest plot
ggplot(data=df, aes (y=index, x=effect, xmin=lower, xmax=upper)) +
  geom_point() +
  geom_errorbarh(height= .1 ) +
  scale_y_continuous(breaks=1: nrow (df), labels=df$study) +
  labs(title=' Effect Size by Study ', x=' Effect Size ', y = ' Study ') +
  geom_vline(xintercept=0, color=' black ', linetype=' dashed ', alpha= .5 ) +
  theme_classic()
