如何在 r 中绘制函数曲线(附示例)
在R中可以使用以下方法绘制函数曲线:
方法一:使用Base R
curve(x^3, from=1, to=50, xlab=' x ', ylab=' y ')
方法2:使用ggplot2
 library (ggplot2)

df <- data. frame (x=c(1, 100))
eq = function(x){x^3}

#plot curve in ggplot2
ggplot(data=df, aes(x=x)) +
  stat_function(fun=eq)
两种方法都会生成一个显示函数y = x 3曲线的图。
以下示例展示了如何在实践中使用每种方法。
示例 1:使用基数 R 绘制函数曲线
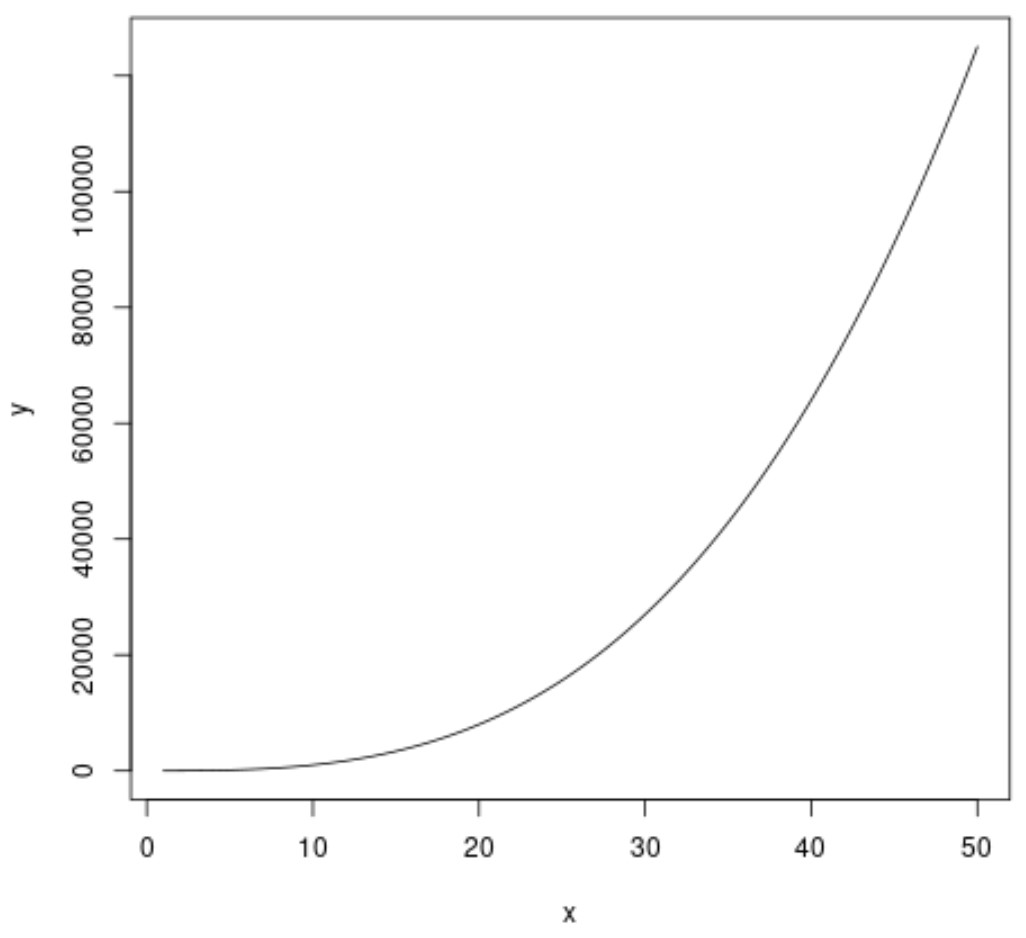
以下代码展示了如何使用基数 R 的Curve()函数绘制函数y = x 3的曲线:
 #plot curve using x-axis range of 1 to 50
curve(x^3, from=1, to=50, xlab=' x ', ylab=' y ')

请注意,您可以使用以下参数来更改曲线的外观:
- lwd :线宽
- 领子: 线条颜色
- 类型:线条样式
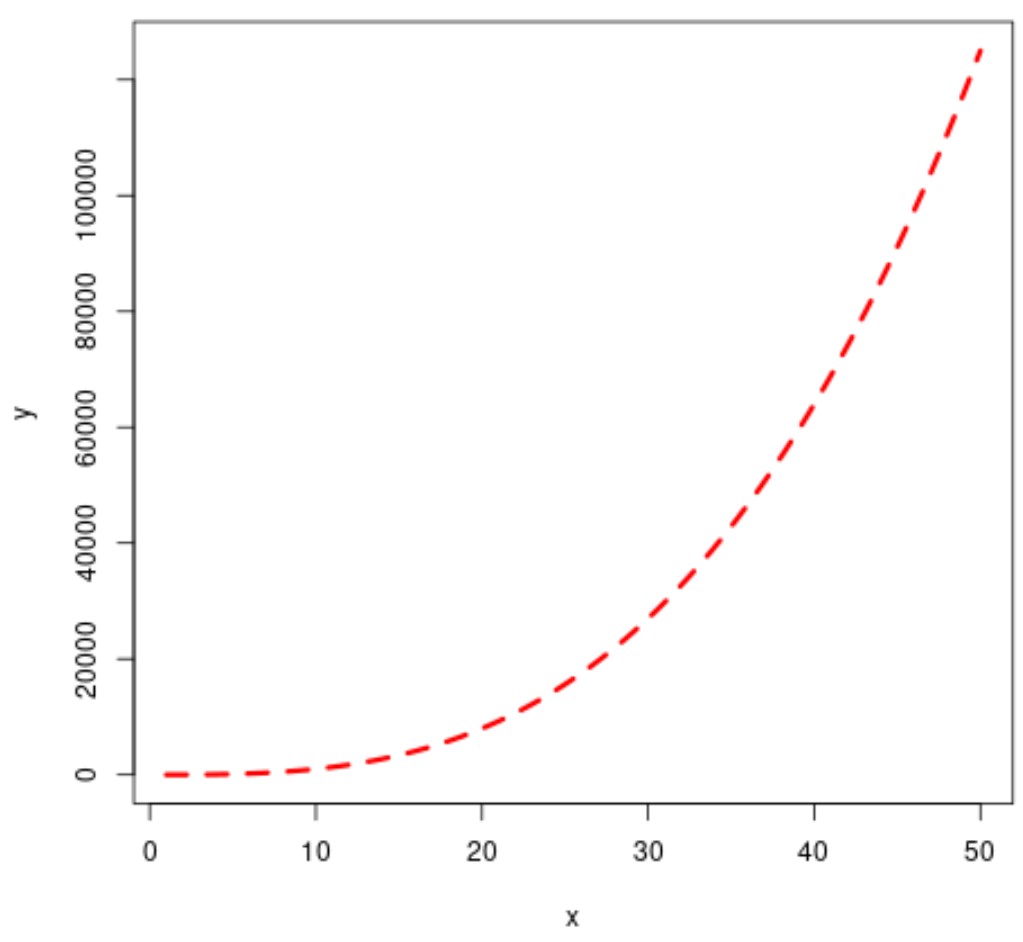
以下代码展示了如何在实践中使用这些参数:
 #plot curve using x-axis range of 1 to 50
curve(x^3, from=1, to=50, xlab=' x ', ylab=' y ', lwd= 3 , col=' red ', lty=' dashed '))

您可以随意使用这些参数的值来创建您想要的精确曲线。
示例 2:使用 ggplot2 绘制函数曲线
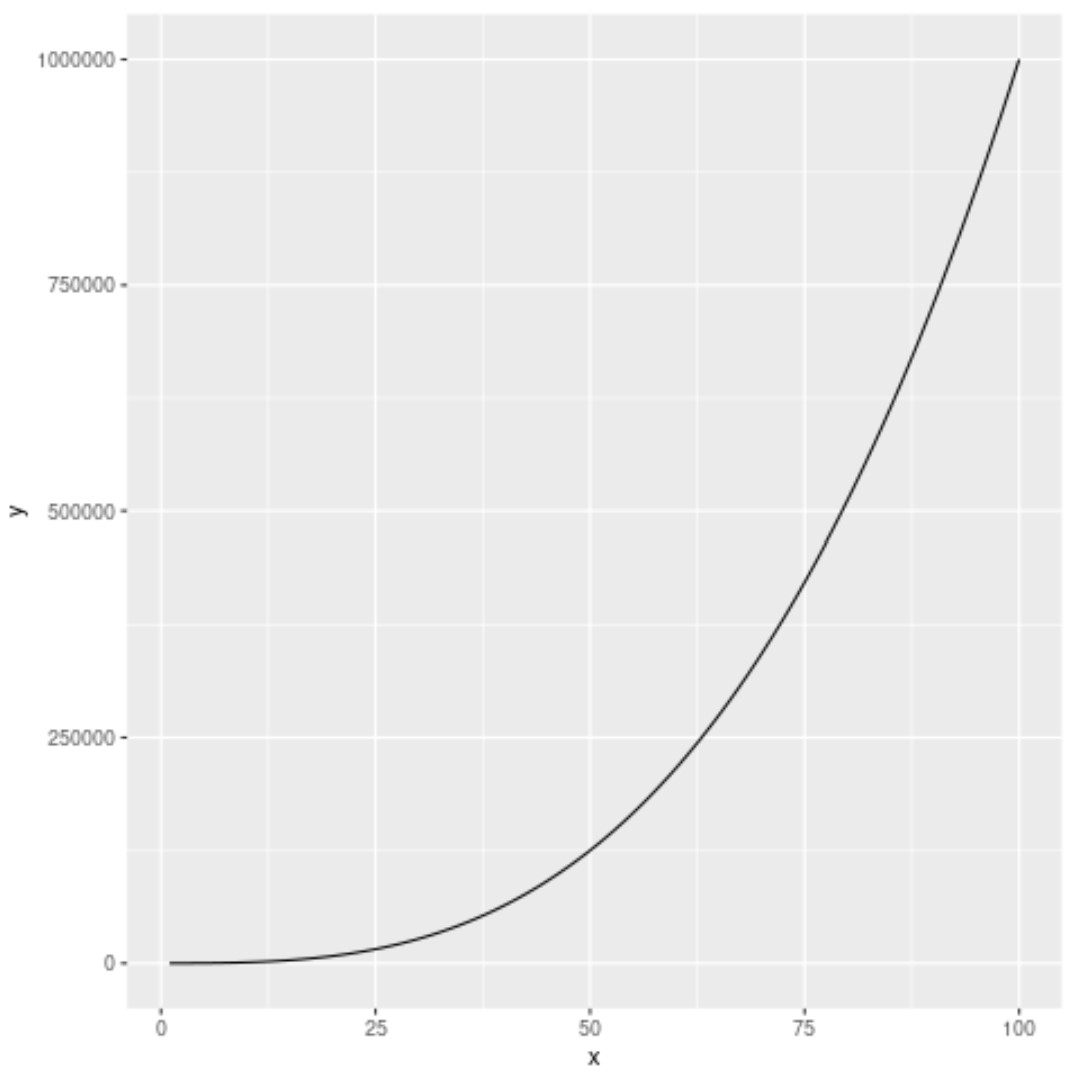
以下代码显示如何使用 ggplot2 stat_function()函数绘制函数y = x 3的图像:
 library (ggplot2)

#define data frame
df <- data. frame (x=c(1, 100))

#define function
eq = function(x){x^3}

#plot curve in ggplot2
ggplot(data=df, aes(x=x)) +
  stat_function(fun=eq)

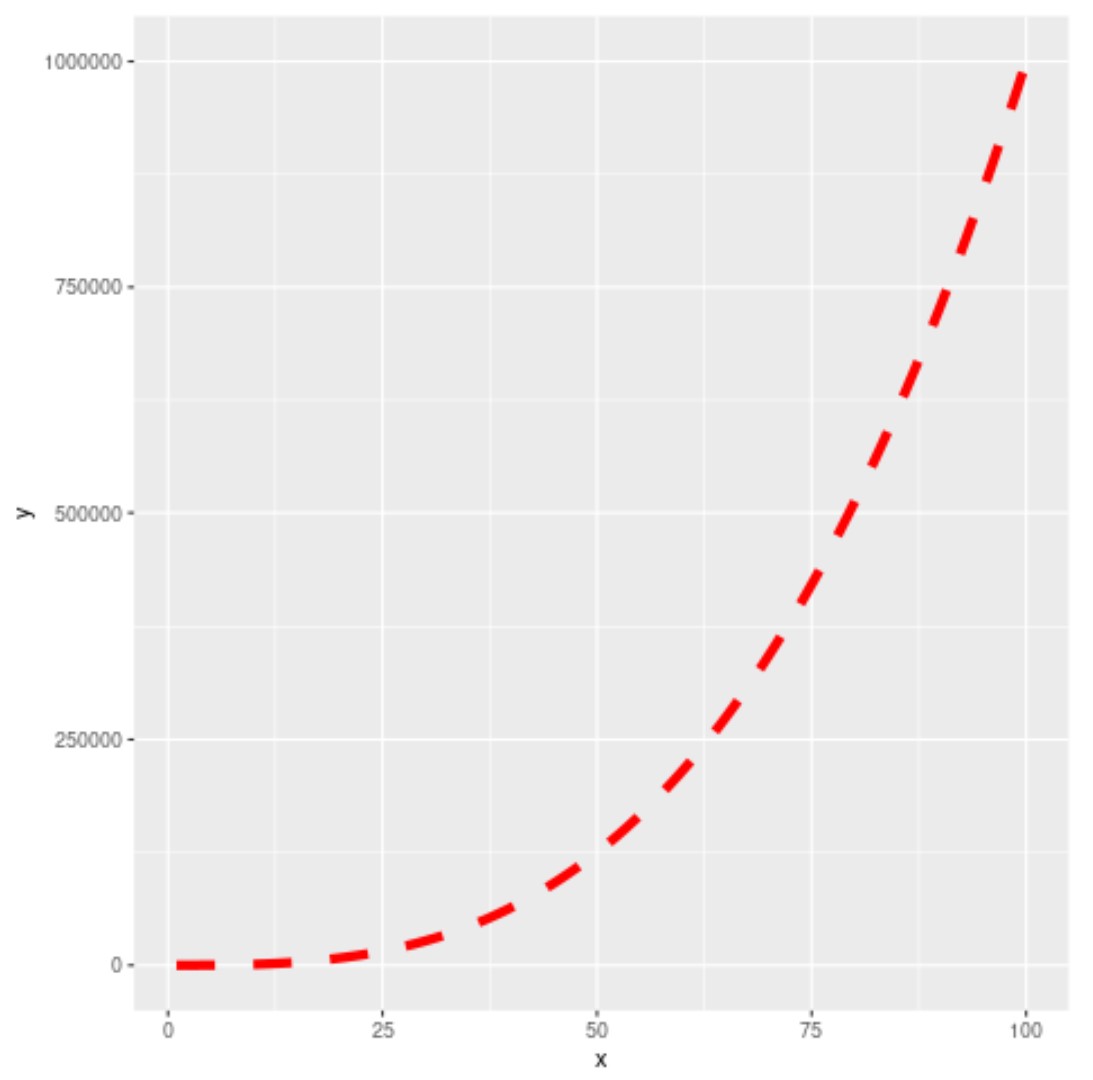
您还可以使用stat_function()函数中的lwd 、 col和lty函数来更改曲线的外观:
 library (ggplot2)

#define data frame
df <- data. frame (x=c(1, 100))

#define function
eq = function(x){x^3}

#plot curve in ggplot2 with custom appearance
ggplot(data=df, aes(x=x)) +
  stat_function(fun=eq, lwd= 2 , col=' red ', lty=' dashed ')

注意:您可以在此处找到 ggplot2 stat_function()函数的完整文档。
其他资源
以下教程解释了如何在 R 中执行其他常见任务: