如何在 r 中的同一张图上绘制多个图(3 个示例)
您可以使用以下方法在 R 中的同一个图形上绘制多个图:
方法一:在同一张图上画多条线
 #plot first line
plot(x, y1, type=' l ')

#add second line to plot
lines(x, y2)
方法 2:并排创建多个路径
 #define plotting area as one row and two columns
by(mfrow = c(1, 2))

#create first plot
plot(x, y1, type=' l ')

#create second plot
plot(x, y2, type=' l ')
方法 3:创建多个垂直堆叠图
 #define plotting area as two rows and one column
by(mfrow = c(2, 1))

#create first plot
plot(x, y1, type=' l ')

#create second plot
plot(x, y2, type=' l ')
以下示例展示了如何在实践中使用每种方法。
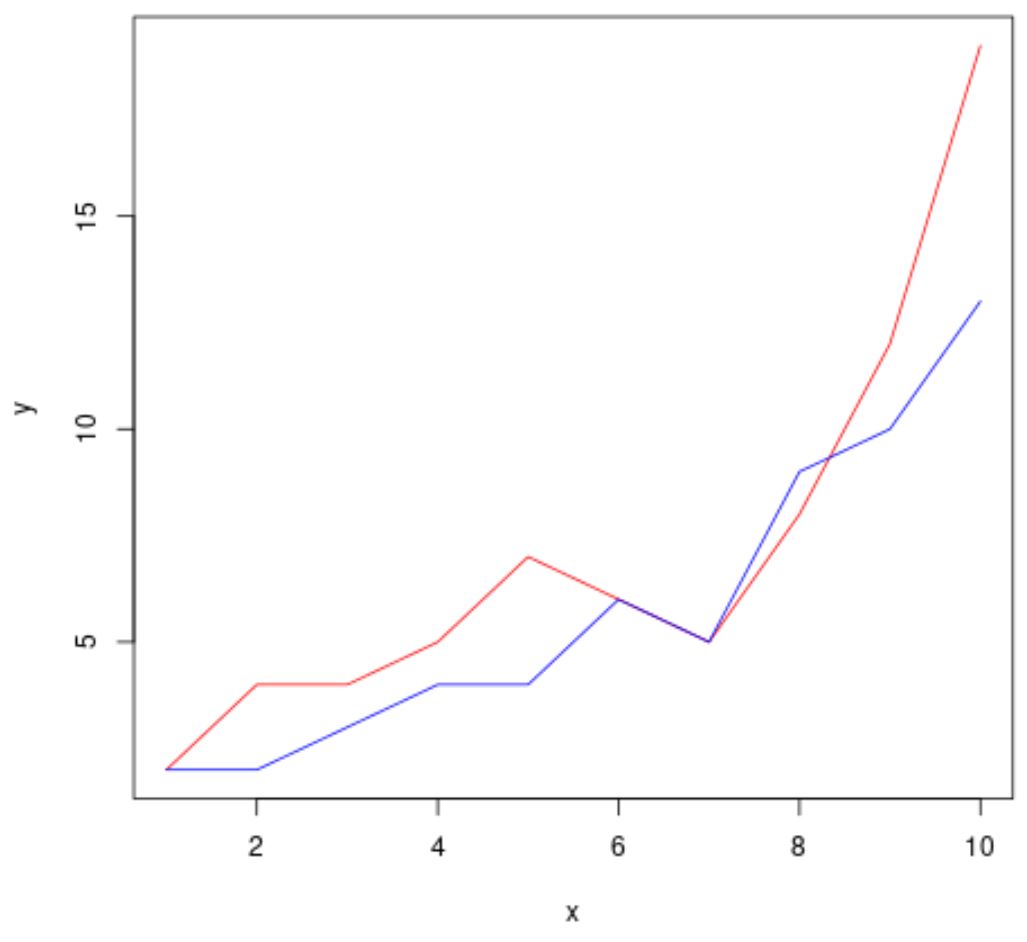
示例 1:在同一个图形上绘制多条线
以下代码展示了如何在 R 中的同一个图形上绘制两条线:
 #define data to plot
x <- 1:10
y1 <- c(2, 4, 4, 5, 7, 6, 5, 8, 12, 19)
y2 <- c(2, 2, 3, 4, 4, 6, 5, 9, 10, 13)

#plot first line
plot(x, y1, type=' l ', col=' red ', xlab=' x ', ylab=' y ')

#add second line to plot
lines(x, y2, col=' blue ')

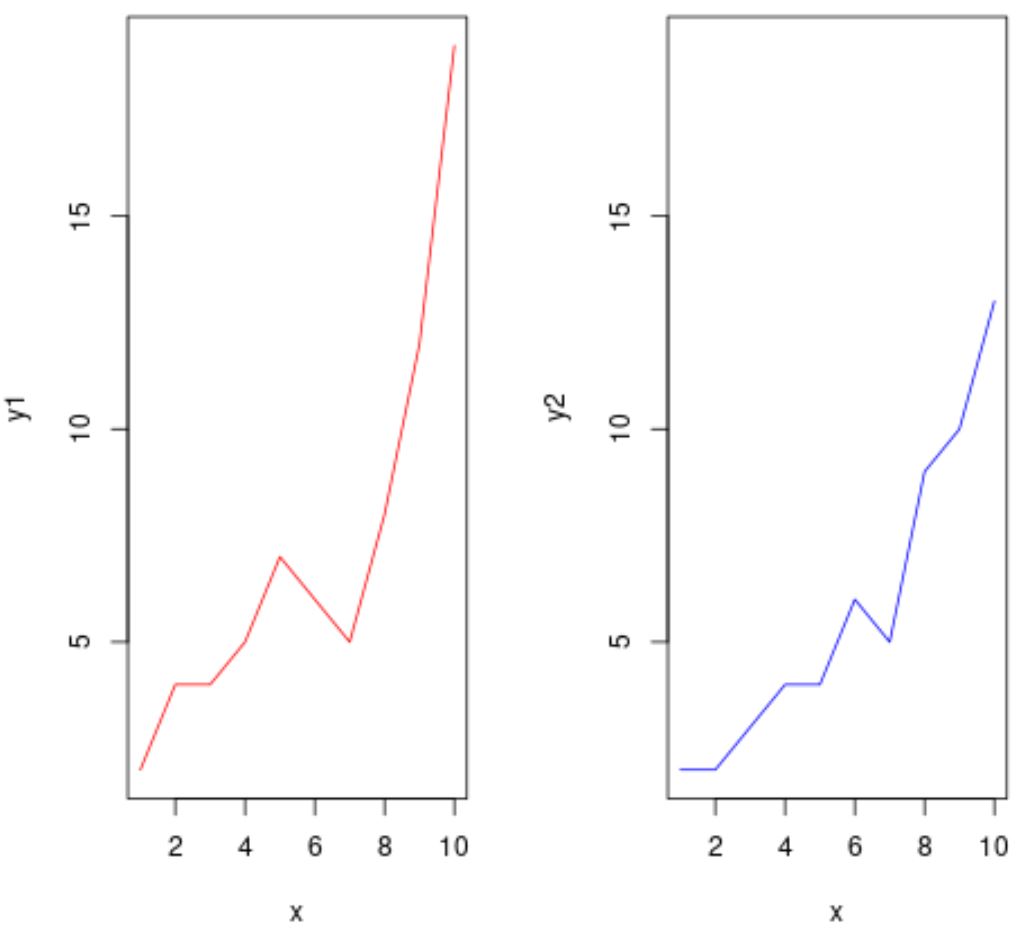
示例 2:并排创建多个路径
以下代码显示如何使用par()参数并排绘制多个图:
 #define data to plot
x <- 1:10
y1 <- c(2, 4, 4, 5, 7, 6, 5, 8, 12, 19)
y2 <- c(2, 2, 3, 4, 4, 6, 5, 9, 10, 13)

#define plotting area as one row and two columns
by(mfrow = c(1, 2))

#create first line plot
plot(x, y1, type=' l ', col=' red ')

#create second line plot
plot(x, y2, type=' l ', col=' blue ', ylim=c(min(y1), max(y1)))

请注意,我们在第二个图中使用ylim()参数来确保两个图在 y 轴上具有相同的限制。
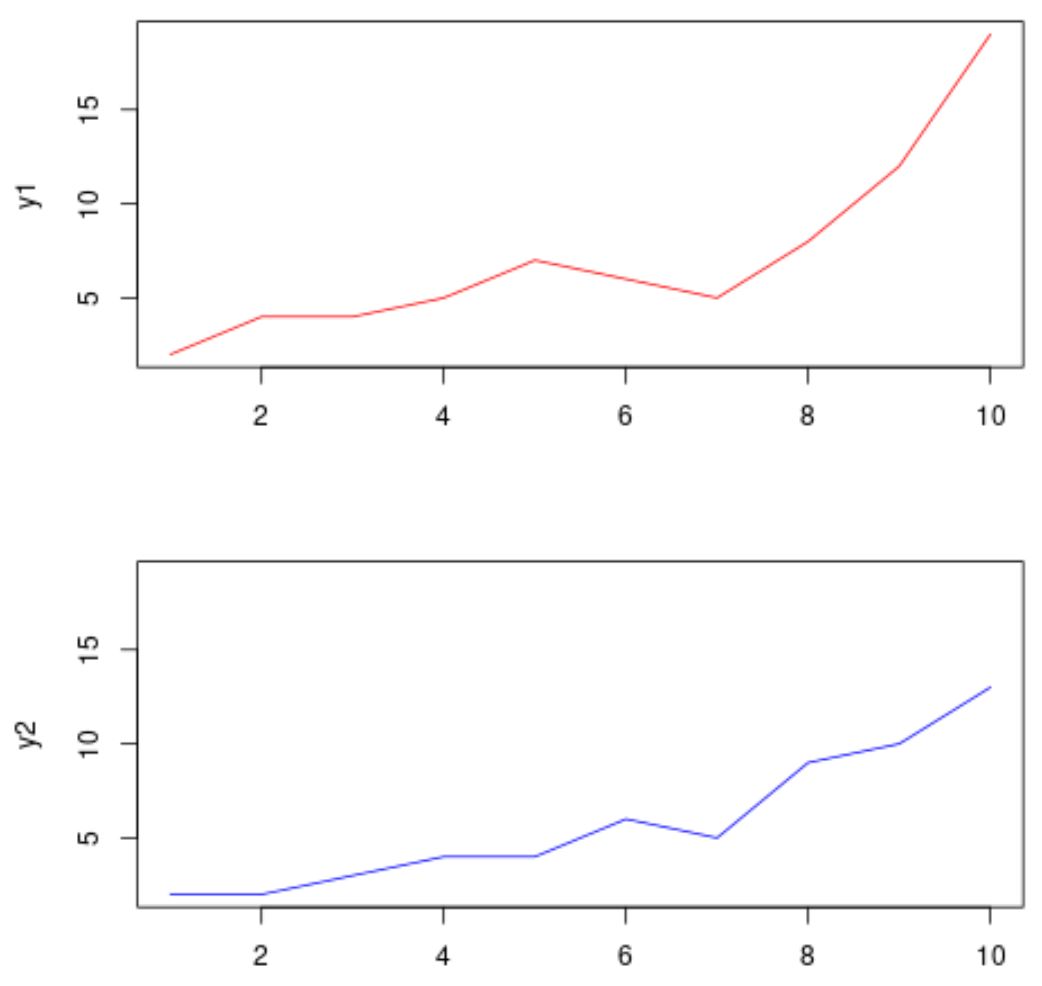
示例 3:创建多个垂直堆叠图
以下代码显示如何使用par()参数绘制多个垂直堆叠图:
 #define data to plot
x <- 1:10
y1 <- c(2, 4, 4, 5, 7, 6, 5, 8, 12, 19)
y2 <- c(2, 2, 3, 4, 4, 6, 5, 9, 10, 13)

#define plotting area as two rows and one column
par(mfrow = c(2, 1), mar = c(2, 4, 4, 2))
#create first line plot
plot(x, y1, type=' l ', col=' red ')

#create second line plot
plot(x, y2, type=' l ', col=' blue ', ylim=c(min(y1), max(y1)))

请注意,我们使用mar参数来指定绘图区域的边距(下、左、上、右)。
注意:默认为 mar = c(5.1, 4.1, 4.1, 2.1)
其他资源
以下教程解释了如何在 R 中执行其他常见任务: