如何更改 r 中的箱线图轴标签(附示例)
您可以使用以下任何方法来更改 R 箱线图上的 X 轴标签:
方法 1:更改 Base R 中的箱线图轴标签
boxplot(df, names=c(' Label 1 ', ' Label 2 ', ' Label 3 '))
方法 2:更改 ggplot2 中的 Boxplot 轴标签
 levels(df_long$variable) <- c(' Label 1 ', ' Label 2 ', ' Label 3 ')

ggplot(df_long, aes(variable, value)) +
  geom_boxplot()
以下示例展示了如何在 R 中使用以下数据框实际使用每种方法:
 #make this example reproducible
set. seeds (0)

#create data frame
df <- data. frame (A=rnorm(1000, mean=5),
                 B=rnorm(1000, mean=10),
                 C=rnorm(1000, mean=15))

#view head of data frame
head(df)

         ABC
1 6.262954 9.713148 15.44435
2 4.673767 11.841107 15.01193
3 6.329799 9.843236 14.99072
4 6.272429 8.610197 14.69762
5 5.414641 8.526896 15.49236
6 3.460050 9.930481 14.39728
示例 1:在 Base R 中编辑箱线图轴标签
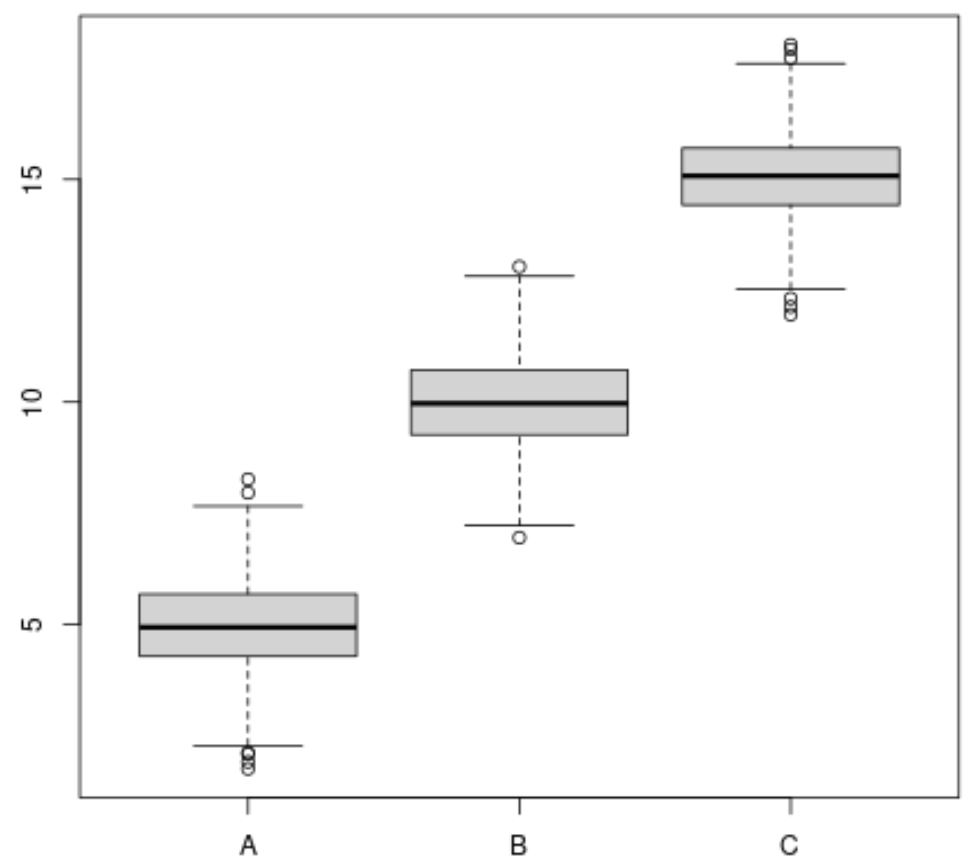
如果我们使用boxplot()函数创建基于 R 的箱线图,则默认情况下数据框中的列名称将用作 x 轴标签:
 #create boxplots
boxplot(df)

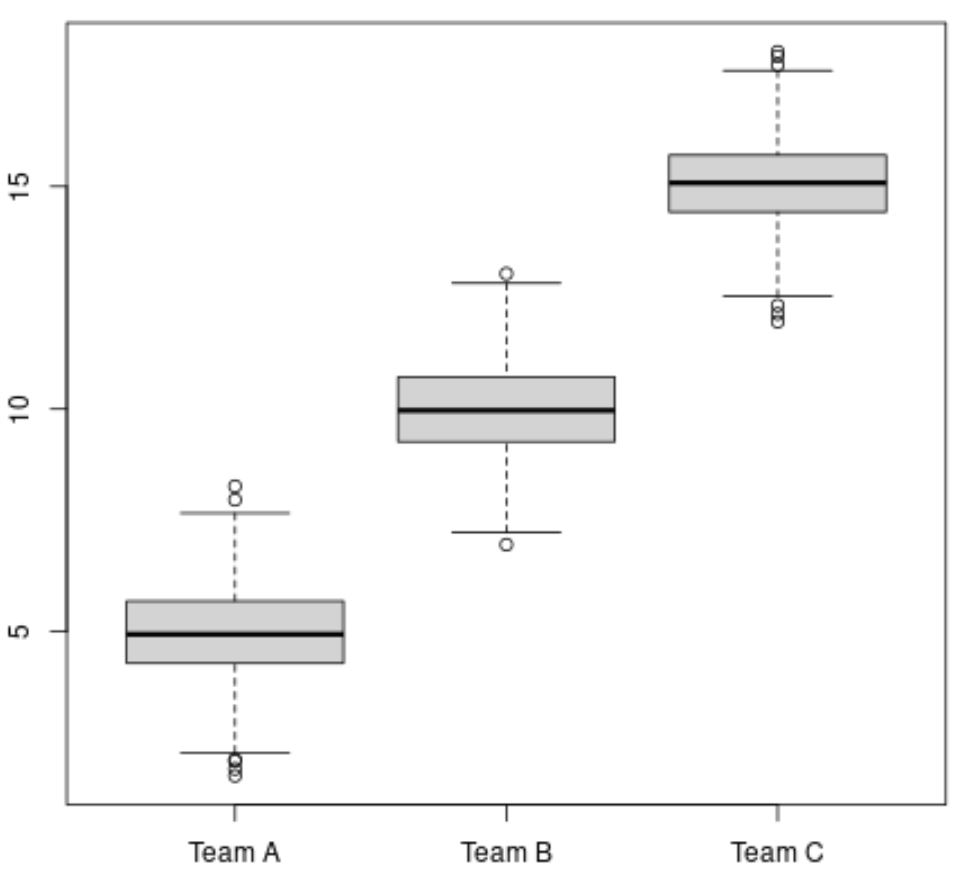
但是,我们可以使用名称参数来指定要使用的 x 轴标签:
 #create boxplots with specific x-axis names
boxplot(df, names=c(' Team A ', ' Team B ', ' Team C '))

请注意,我们在名称参数中指定的标签现在用作 x 轴标签。
示例 2:更改 ggplot2 中的箱线图轴标签
在 ggplot2 中创建箱线图之前,我们需要使用reshape2包中的Melt()函数将数据框“融化”为长格式:
 library (reshape2)

#reshape data frame to long format
df_long <- melt(df)

#view head of long data frame
head(df_long)

  variable value
1 A 6.262954
2 A 4.673767
3 A 6.329799
4 A 6.272429
5 A 5.414641
6 A 3.460050
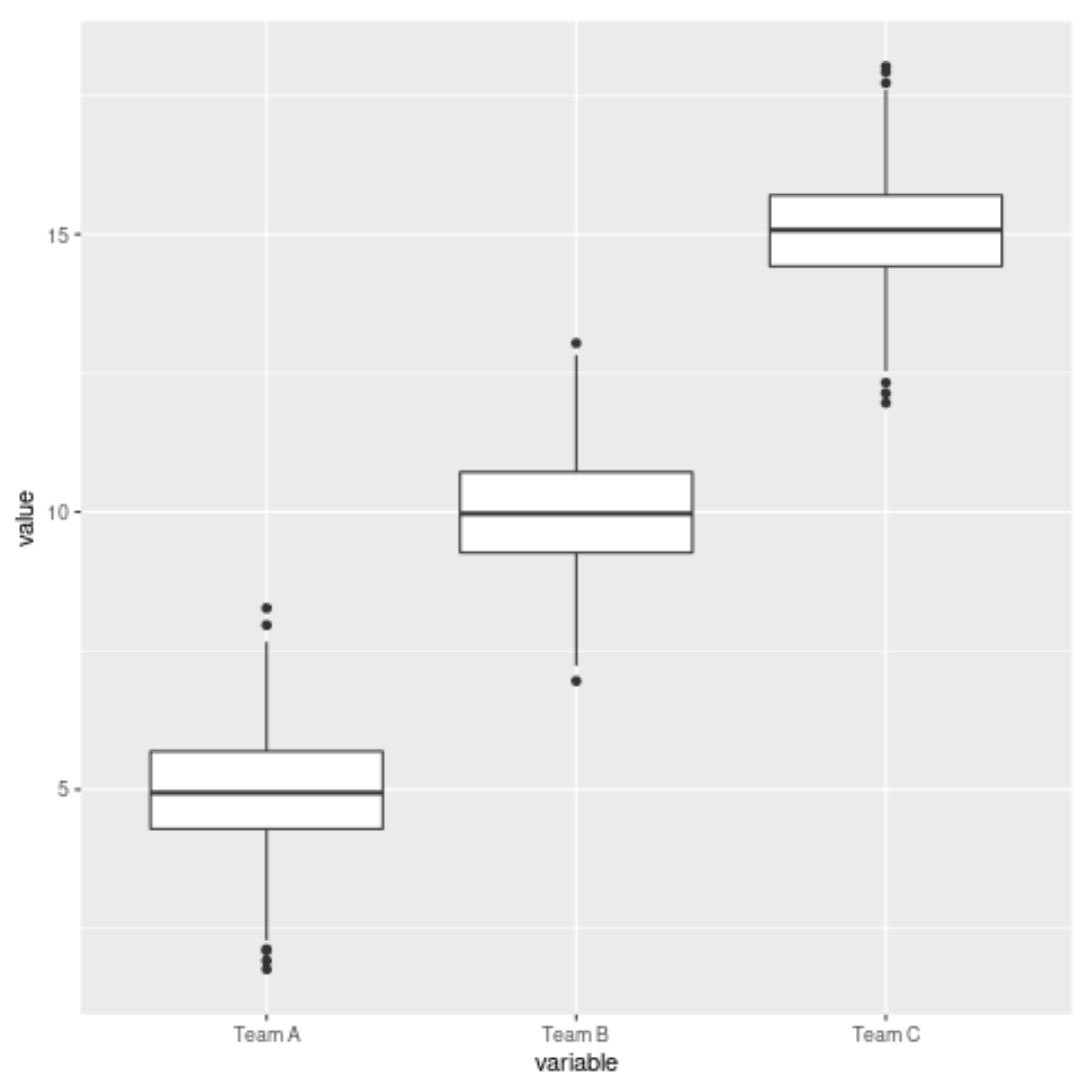
然后我们可以使用levels()函数指定x轴标签,并使用geom_boxplot()函数在ggplot2中实际创建箱线图:
 library (ggplot2)

#specify x-axis names to use
levels(df_long$variable) <- c(' Team A ', ' Team B ', ' Team C ')

#create box plot with specific x-axis labels
ggplot(df_long, aes(variable, value)) +
  geom_boxplot()

请注意,我们使用级别函数指定的标签现在用作 X 轴标签。
其他资源
以下教程解释了如何在 R 中执行其他常见任务: