如何在 r 中使用 lines() 函数(附示例)
您可以使用 R 中的lines()函数将新线添加到现有的基本R图中。
该函数使用以下语法:
lines(x, y, col, lwd, lty)
金子:
- x:用于新线的 x 坐标向量
- y :用于新线的 y 坐标向量
- col : 新线的颜色
- lwd : 新行的宽度
- lty :新线路的线路类型
以下示例展示了如何在实践中使用lines()函数。
示例:如何在 R 中使用lines()函数
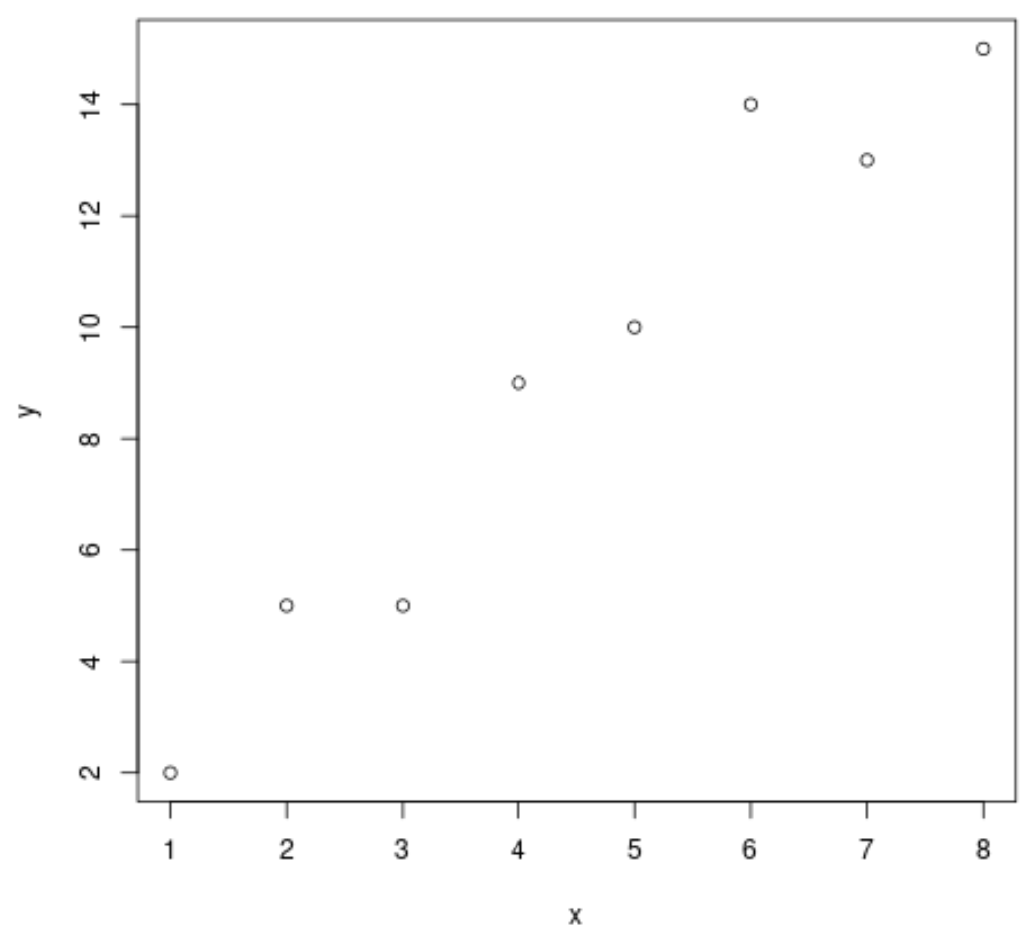
假设我们使用以下代码在基础 R 中创建一个简单的点云:
 #define (x, y) coordinates
x <- c(1, 2, 3, 4, 5, 6, 7, 8)
y <- c(2, 5, 5, 9, 10, 14, 13, 15)

#create scatterplot
plot(x, y)

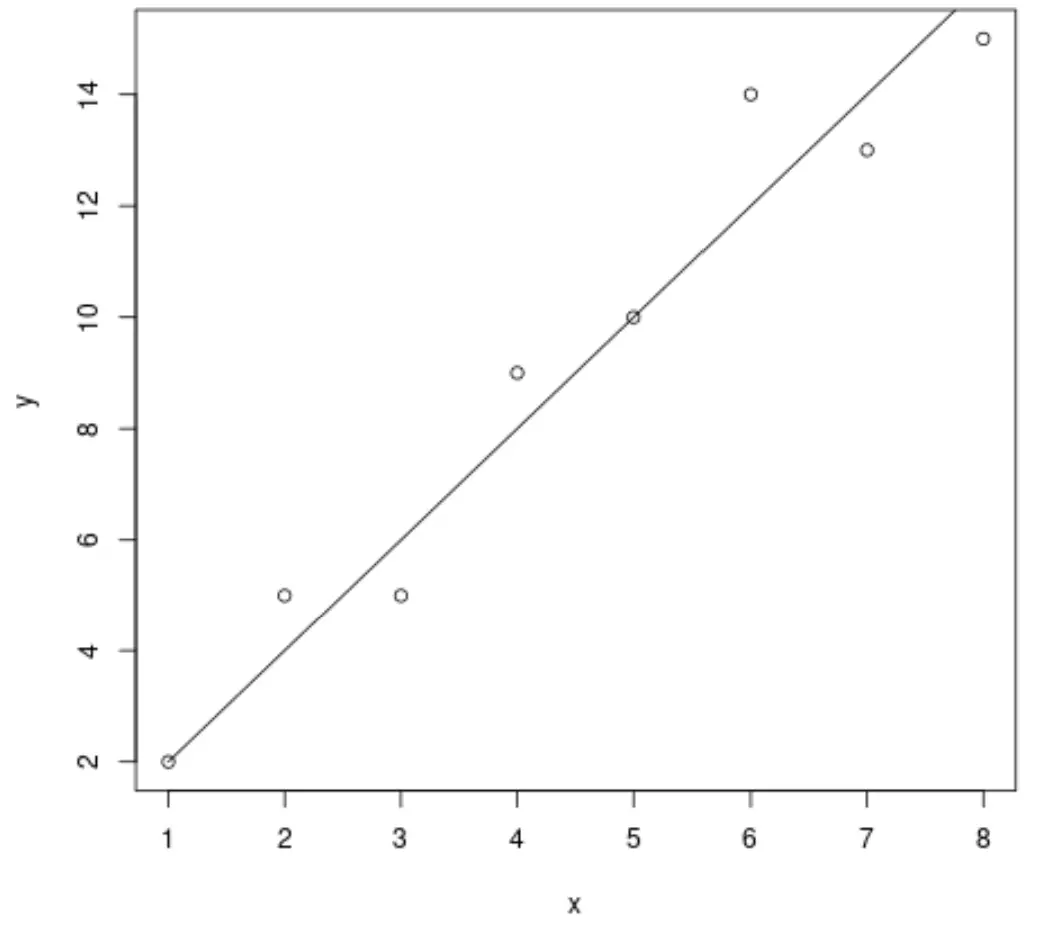
我们可以使用lines()函数将具有特定坐标(x,y)的线添加到图中:
 #define (x, y) coordinates
x <- c(1, 2, 3, 4, 5, 6, 7, 8)
y <- c(2, 5, 5, 9, 10, 14, 13, 15)

#create scatterplot
plot(x, y)

#define (x, y) coordinates for new line to add
x_line <- c(1, 2, 3, 4, 5, 6, 7, 8)
y_line <- c(2, 4, 6, 8, 10, 12, 14, 16)

#add new line to plot
lines(x_line, y_line)

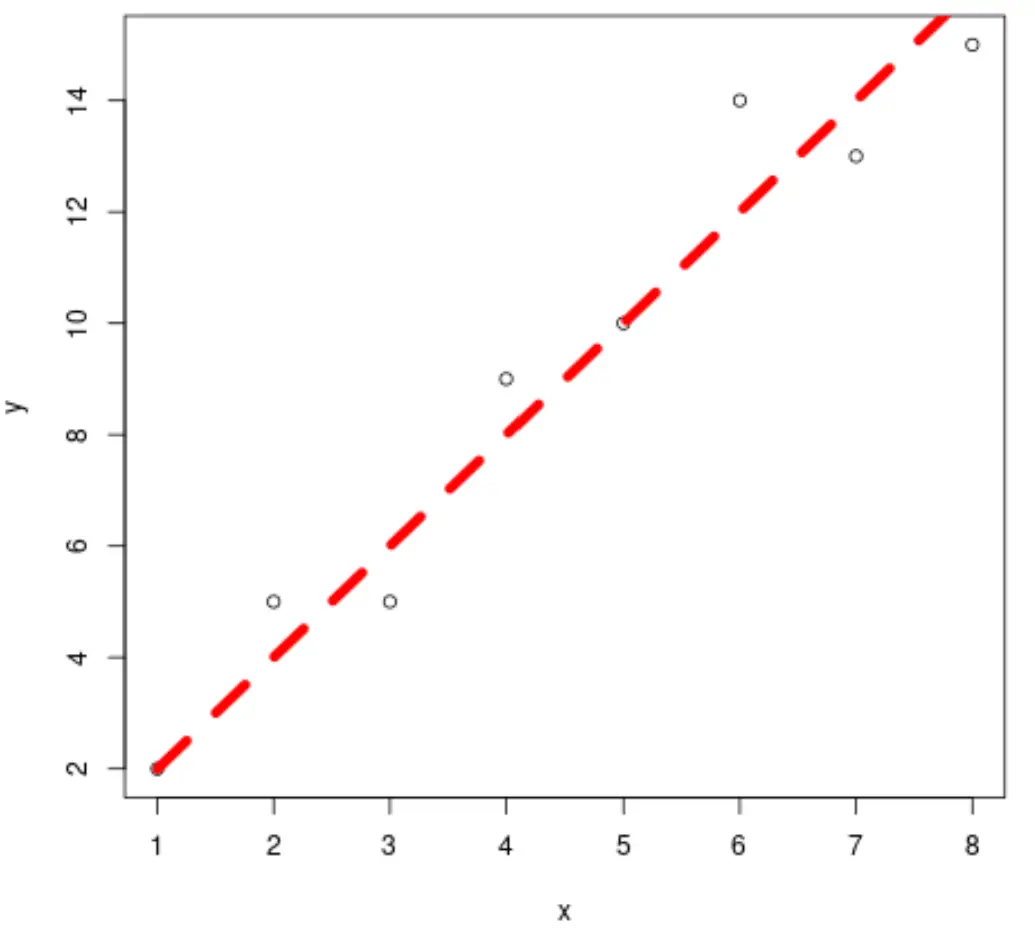
我们还可以使用col 、 lwd和lty参数来更改新行的颜色、宽度和线条样式:
 #define (x, y) coordinates
x <- c(1, 2, 3, 4, 5, 6, 7, 8)
y <- c(2, 5, 5, 9, 10, 14, 13, 15)

#create scatterplot
plot(x, y)

#define (x, y) coordinates for new line to add
x_line <- c(1, 2, 3, 4, 5, 6, 7, 8)
y_line <- c(2, 4, 6, 8, 10, 12, 14, 16)

#add new line to plot with custom style
lines(x_line, y_line, col=' red ', lwd= 6 , lty=' dashed ')

您可以随意修改lines()函数中不同参数的值,以添加具有您想要的确切样式的新行。
其他资源
以下教程解释了如何在 R 中执行其他常见任务:
如何在 R 中使用 aline() 向绘图添加直线
如何在 R 中创建带有回归线的散点图
ggplot2中如何调整线条粗细