R 中的线性判别分析(逐步)
当您有一组预测变量并希望将响应变量分类为两个或多个类时,可以使用 线性判别分析方法。
本教程提供了如何在 R 中执行线性判别分析的分步示例。
第 1 步:加载必要的库
首先,我们将加载此示例所需的库:
 library (MASS)
library (ggplot2)
第2步:加载数据
在本例中,我们将使用 R 中内置的iris数据集。以下代码演示了如何加载和显示该数据集:
 #attach iris dataset to make it easy to work with
attach(iris)

#view structure of dataset
str(iris)

'data.frame': 150 obs. of 5 variables:
 $ Sepal.Length: num 5.1 4.9 4.7 4.6 5 5.4 4.6 5 4.4 4.9 ...
 $ Sepal.Width: num 3.5 3 3.2 3.1 3.6 3.9 3.4 3.4 2.9 3.1 ...
 $Petal.Length: num 1.4 1.4 1.3 1.5 1.4 1.7 1.4 1.5 1.4 1.5 ...
 $Petal.Width: num 0.2 0.2 0.2 0.2 0.2 0.4 0.3 0.2 0.2 0.1 ...
 $ Species: Factor w/ 3 levels "setosa","versicolor",..: 1 1 1 1 1 1 1 ...
我们可以看到数据集总共包含 5 个变量和 150 个观测值。
对于这个例子,我们将构建一个线性判别分析模型来对给定花朵所属的物种进行分类。
我们将在模型中使用以下预测变量:
- 萼片长度
- 萼片宽度
- 花瓣长度
- 花瓣宽度
我们将使用它们来预测物种响应变量,该变量支持以下三个潜在类别:
- 山毛榉
- 杂色
- 弗吉尼亚州
第 3 步:缩放数据
线性判别分析的关键假设之一是每个预测变量具有相同的方差。确保满足此假设的一个简单方法是缩放每个变量,使其平均值为 0,标准差为 1。
我们可以在 R 中使用scale()函数快速做到这一点:
 #scale each predictor variable (ie first 4 columns)
iris[1:4] <- scale(iris[1:4])
我们可以使用apply() 函数来验证每个预测变量现在的平均值为 0,标准差为 1:
 #find mean of each predictor variable
apply(iris[1:4], 2, mean)

 Sepal.Length Sepal.Width Petal.Length Petal.Width
-4.484318e-16 2.034094e-16 -2.895326e-17 -3.663049e-17

#find standard deviation of each predictor variable
apply(iris[1:4], 2, sd)

Sepal.Length Sepal.Width Petal.Length Petal.Width
           1 1 1 1
第 4 步:创建训练和测试样本
接下来,我们将数据集分为用于训练模型的训练集和用于测试模型的测试集:
 #make this example reproducible
set.seed(1)

#Use 70% of dataset as training set and remaining 30% as testing set
sample <- sample(c( TRUE , FALSE ), nrow (iris), replace = TRUE , prob =c(0.7,0.3))
train <- iris[sample, ]
test <- iris[!sample, ]
步骤5:调整LDA模型
接下来,我们将使用MASS包中的lda() 函数来使 LDA 模型适应我们的数据:
 #fit LDA model
model <- lda(Species~., data=train)

#view model output
model

Call:
lda(Species ~ ., data = train)

Prior probabilities of groups:
    setosa versicolor virginica
 0.3207547 0.3207547 0.3584906

Group means:
           Sepal.Length Sepal.Width Petal.Length Petal.Width
setosa -1.0397484 0.8131654 -1.2891006 -1.2570316
versicolor 0.1820921 -0.6038909 0.3403524 0.2208153
virginica 0.9582674 -0.1919146 1.0389776 1.1229172

Coefficients of linear discriminants:
                    LD1 LD2
Sepal.Length 0.7922820 0.5294210
Sepal.Width 0.5710586 0.7130743
Petal.Length -4.0762061 -2.7305131
Petal.Width -2.0602181 2.6326229

Proportion of traces:
   LD1 LD2
0.9921 0.0079
以下是解释模型结果的方法:
组先验概率:这些代表训练集中每个物种的比例。例如,训练集中所有观测值的 35.8% 是针对virginica物种的。
组平均值:显示每个物种的每个预测变量的平均值。
线性判别系数:这些显示用于训练 LDA 模型决策规则的预测变量的线性组合。例如:
- LD1: 0.792 * 萼片长度 + 0.571 * 萼片宽度 – 4.076 * 花瓣长度 – 2.06 * 花瓣宽度
- LD2: 0.529 * 萼片长度 + 0.713 * 萼片宽度 – 2.731 * 花瓣长度 + 2.63 * 花瓣宽度
迹线比例:显示每个线性判别函数实现的分离百分比。
第 6 步:使用模型进行预测
一旦我们使用训练数据拟合了模型,我们就可以用它来对测试数据进行预测:
 #use LDA model to make predictions on test data
predicted <- predict (model, test)

names(predicted)

[1] "class" "posterior" "x"
这将返回一个包含三个变量的列表:
- 类别:预测类别
- 后验:观察结果属于每个类别的后验概率
- x:线性判别式
我们可以快速可视化测试数据集中前六个观察结果的每一个结果:
 #view predicted class for first six observations in test set
head(predicted$class)

[1] setosa setosa setosa setosa setosa setosa
Levels: setosa versicolor virginica

#view posterior probabilities for first six observations in test set
head(predicted$posterior)

   setosa versicolor virginica
4 1 2.425563e-17 1.341984e-35
6 1 1.400976e-21 4.482684e-40
7 1 3.345770e-19 1.511748e-37
15 1 6.389105e-31 7.361660e-53
17 1 1.193282e-25 2.238696e-45
18 1 6.445594e-22 4.894053e-41

#view linear discriminants for first six observations in test set
head(predicted$x)

         LD1 LD2
4 7.150360 -0.7177382
6 7.961538 1.4839408
7 7.504033 0.2731178
15 10.170378 1.9859027
17 8.885168 2.1026494
18 8.113443 0.7563902
我们可以使用以下代码来查看 LDA 模型正确预测物种的观测百分比:
 #find accuracy of model
mean(predicted$class==test$Species)

[1] 1
事实证明,该模型正确预测了测试数据集中100%的观测值的物种。
在现实世界中,LDA 模型很少能正确预测每个类别的结果,但这个虹膜数据集的构造方式很简单,机器学习算法往往表现良好。
第 7 步:可视化结果
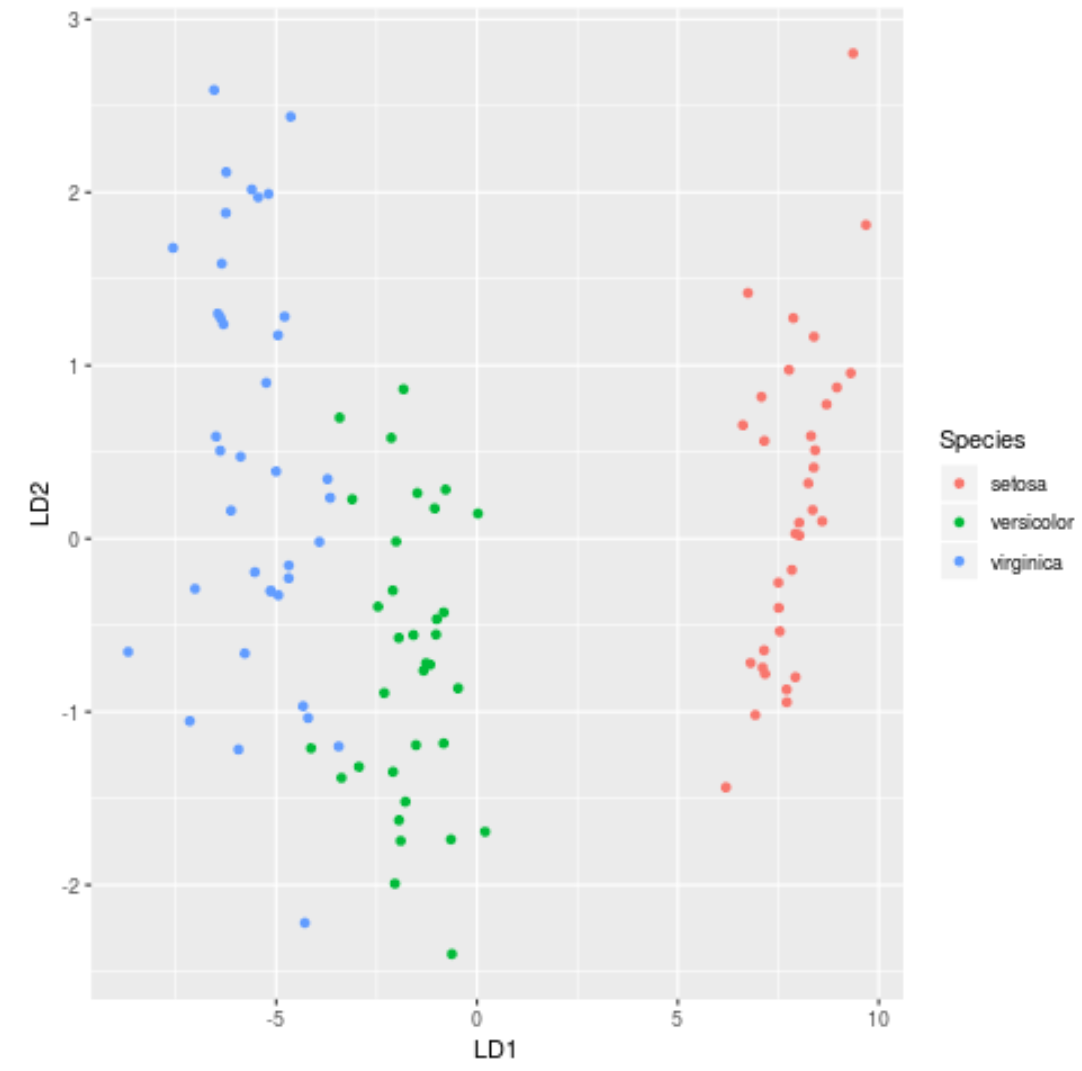
最后,我们可以创建一个 LDA 图来可视化模型的线性判别式,并可视化它在数据集中区分三个不同物种的效果:
 #define data to plot
lda_plot <- cbind(train, predict(model)$x)

#createplot
ggplot(lda_plot, aes (LD1, LD2)) +
  geom_point( aes (color=Species))

您可以在此处找到本教程中使用的完整 R 代码。