R 中的曲线拟合(带有示例)
通常,您可能希望找到最适合 R 曲线的方程。

以下分步示例说明了如何使用poly()函数将曲线拟合到 R 中的数据,以及如何确定哪条曲线最适合数据。
第 1 步:创建数据并可视化
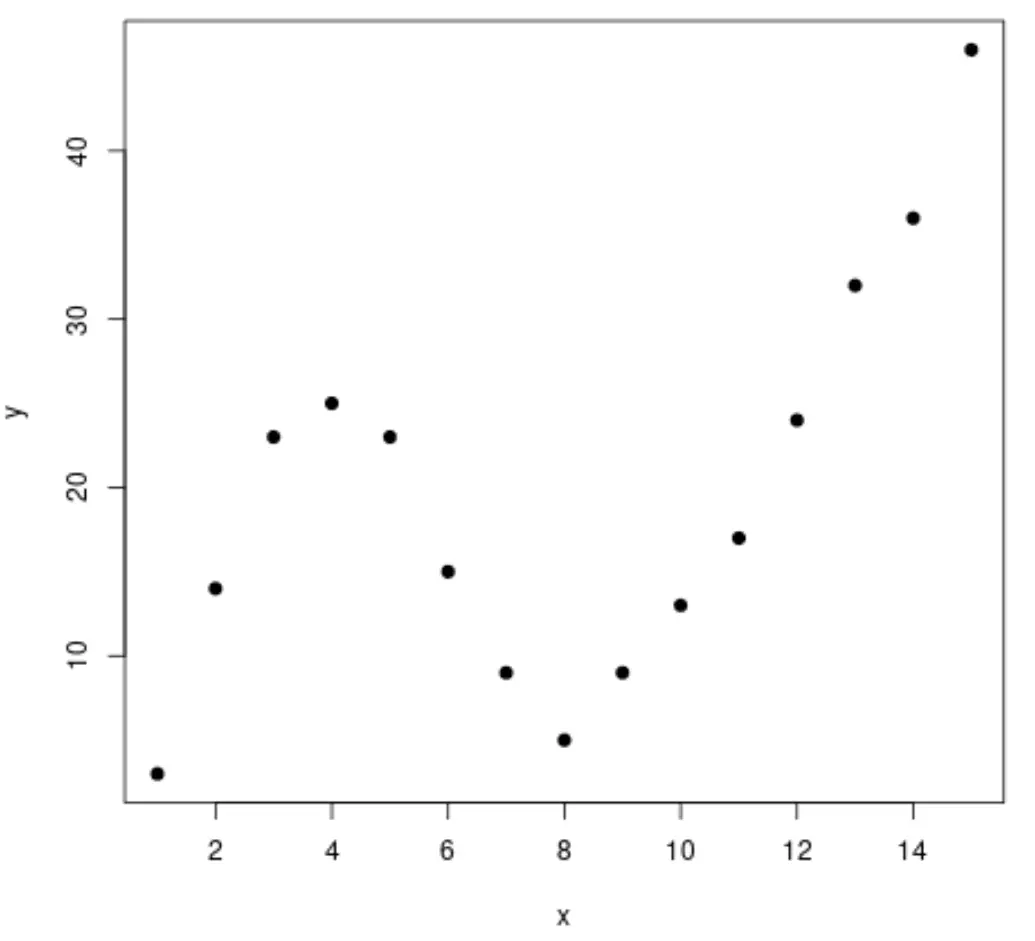
让我们首先创建一个假数据集,然后创建一个散点图来可视化数据:
 #create data frame
df <- data. frame (x=1:15,
                 y=c(3, 14, 23, 25, 23, 15, 9, 5, 9, 13, 17, 24, 32, 36, 46))

#create a scatterplot of x vs. y
plot(df$x, df$y, pch= 19 , xlab=' x ', ylab=' y ')

第2步:调整多条曲线
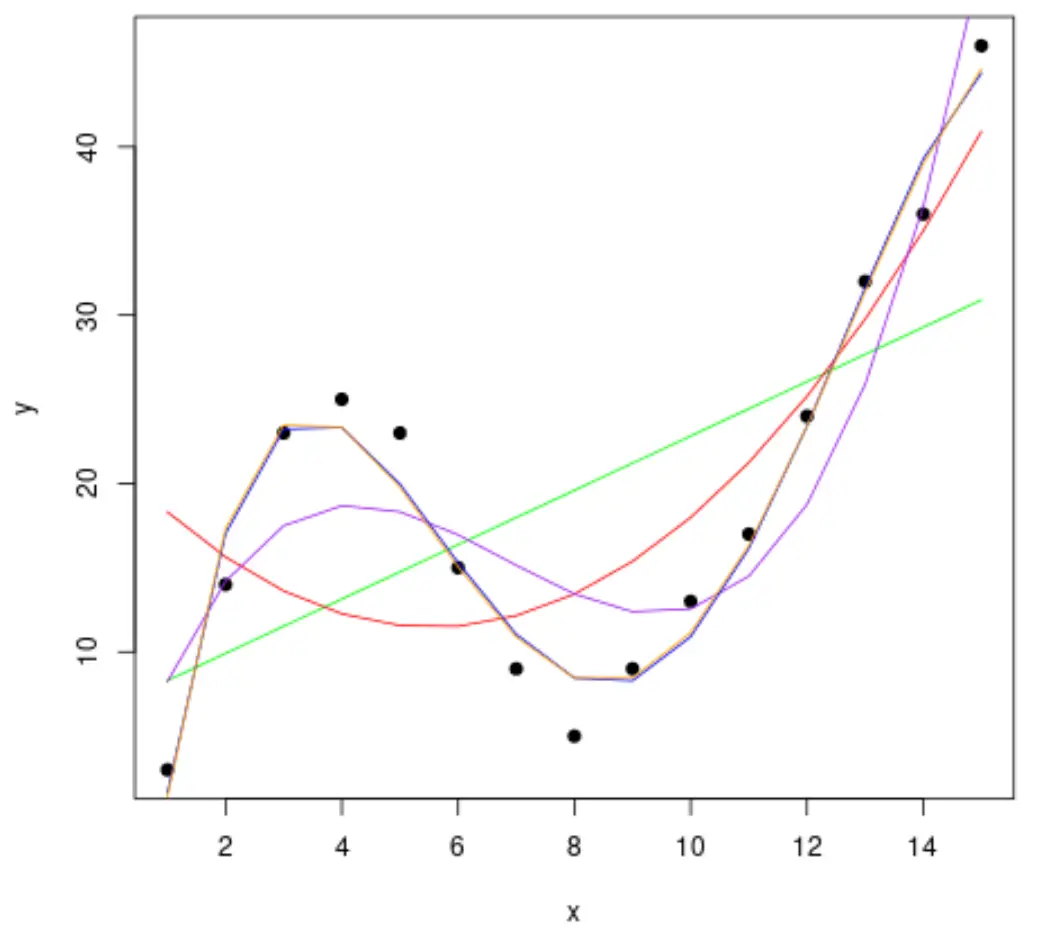
然后,让我们将几个多项式回归模型拟合到数据,并在同一图中可视化每个模型的曲线:
 #fit polynomial regression models up to degree 5
fit1 <- lm(y~x, data=df)
fit2 <- lm(y~poly(x,2,raw= TRUE ), data=df)
fit3 <- lm(y~poly(x,3,raw= TRUE ), data=df)
fit4 <- lm(y~poly(x,4,raw= TRUE ), data=df)
fit5 <- lm(y~poly(x,5,raw= TRUE ), data=df)

#create a scatterplot of x vs. y
plot(df$x, df$y, pch=19, xlab=' x ', ylab=' y ')

#define x-axis values
x_axis <- seq(1, 15, length= 15 )

#add curve of each model to plot
lines(x_axis, predict(fit1, data. frame (x=x_axis)), col=' green ')
lines(x_axis, predict(fit2, data. frame (x=x_axis)), col=' red ')
lines(x_axis, predict(fit3, data. frame (x=x_axis)), col=' purple ')
lines(x_axis, predict(fit4, data. frame (x=x_axis)), col=' blue ')
lines(x_axis, predict(fit5, data. frame (x=x_axis)), col=' orange ')

为了确定哪条曲线最适合数据,我们可以查看每个模型的调整后的 R 方。
该值告诉我们可以由模型中的预测变量解释的响应变量的变化百分比,并根据预测变量的数量进行调整。
 #calculated adjusted R-squared of each model
summary(fit1)$adj. r . squared
summary(fit2)$adj. r . squared
summary(fit3)$adj. r . squared
summary(fit4)$adj. r . squared
summary(fit5)$adj. r . squared

[1] 0.3144819
[1] 0.5186706
[1] 0.7842864
[1] 0.9590276
[1] 0.9549709
从结果中我们可以看到,调整 R 平方最高的模型是四次多项式,其调整 R 平方为0.959 。
第 3 步:可视化最终曲线
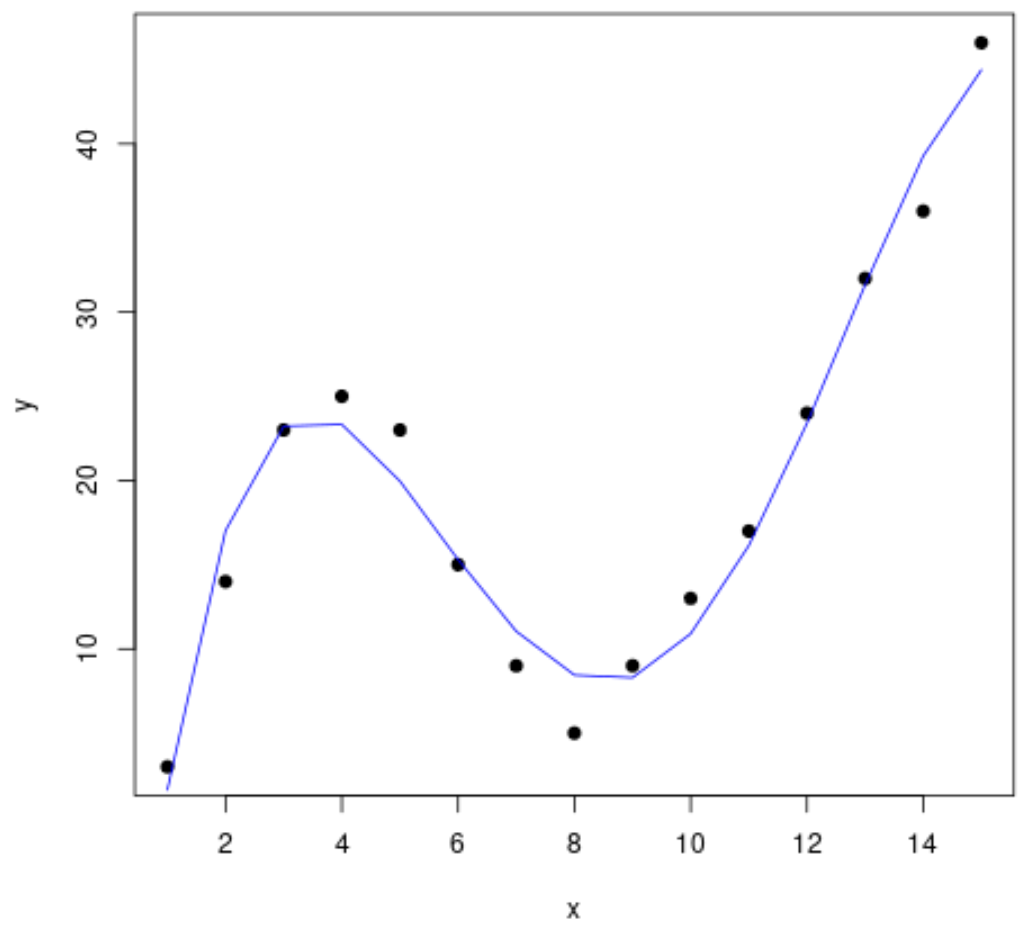
最后,我们可以用四次多项式模型的曲线创建散点图:
 #create a scatterplot of x vs. y
plot(df$x, df$y, pch=19, xlab=' x ', ylab=' y ')

#define x-axis values
x_axis <- seq(1, 15, length= 15 )

#add curve of fourth-degree polynomial model
lines(x_axis, predict(fit4, data. frame (x=x_axis)), col=' blue ')

我们还可以使用summary()函数得到这条线的方程:
 summary(fit4)

Call:
lm(formula = y ~ poly(x, 4, raw = TRUE), data = df)

Residuals:
    Min 1Q Median 3Q Max
-3.4490 -1.1732 0.6023 1.4899 3.0351

Coefficients:
                         Estimate Std. Error t value Pr(>|t|)
(Intercept) -26.51615 4.94555 -5.362 0.000318 ***
poly(x, 4, raw = TRUE)1 35.82311 3.98204 8.996 4.15e-06 ***
poly(x, 4, raw = TRUE)2 -8.36486 0.96791 -8.642 5.95e-06 ***
poly(x, 4, raw = TRUE)3 0.70812 0.08954 7.908 1.30e-05 ***
poly(x, 4, raw = TRUE)4 -0.01924 0.00278 -6.922 4.08e-05 ***
---
Significant. codes: 0 '***' 0.001 '**' 0.01 '*' 0.05 '.' 0.1 ' ' 1

Residual standard error: 2.424 on 10 degrees of freedom
Multiple R-squared: 0.9707, Adjusted R-squared: 0.959
F-statistic: 82.92 on 4 and 10 DF, p-value: 1.257e-07
曲线方程如下:
y = -0.0192x 4 + 0.7081x 3 – 8.3649x 2 + 35.823x – 26.516
我们可以使用该方程根据模型中的预测变量来预测响应变量的值。例如,如果x = 4 那么我们将预测y = 23.34 :
y = -0.0192(4) 4 + 0.7081(4) 3 – 8.3649(4) 2 + 35.823(4) – 26.516 = 23.34