如何更改 r 图中的轴比例(附示例)
通常,您可能希望更改 R 图中轴上使用的比例。
本教程介绍如何更改基本 R 和 ggplot2 绘图上的轴刻度。
示例1:修改R数据库中的轴刻度
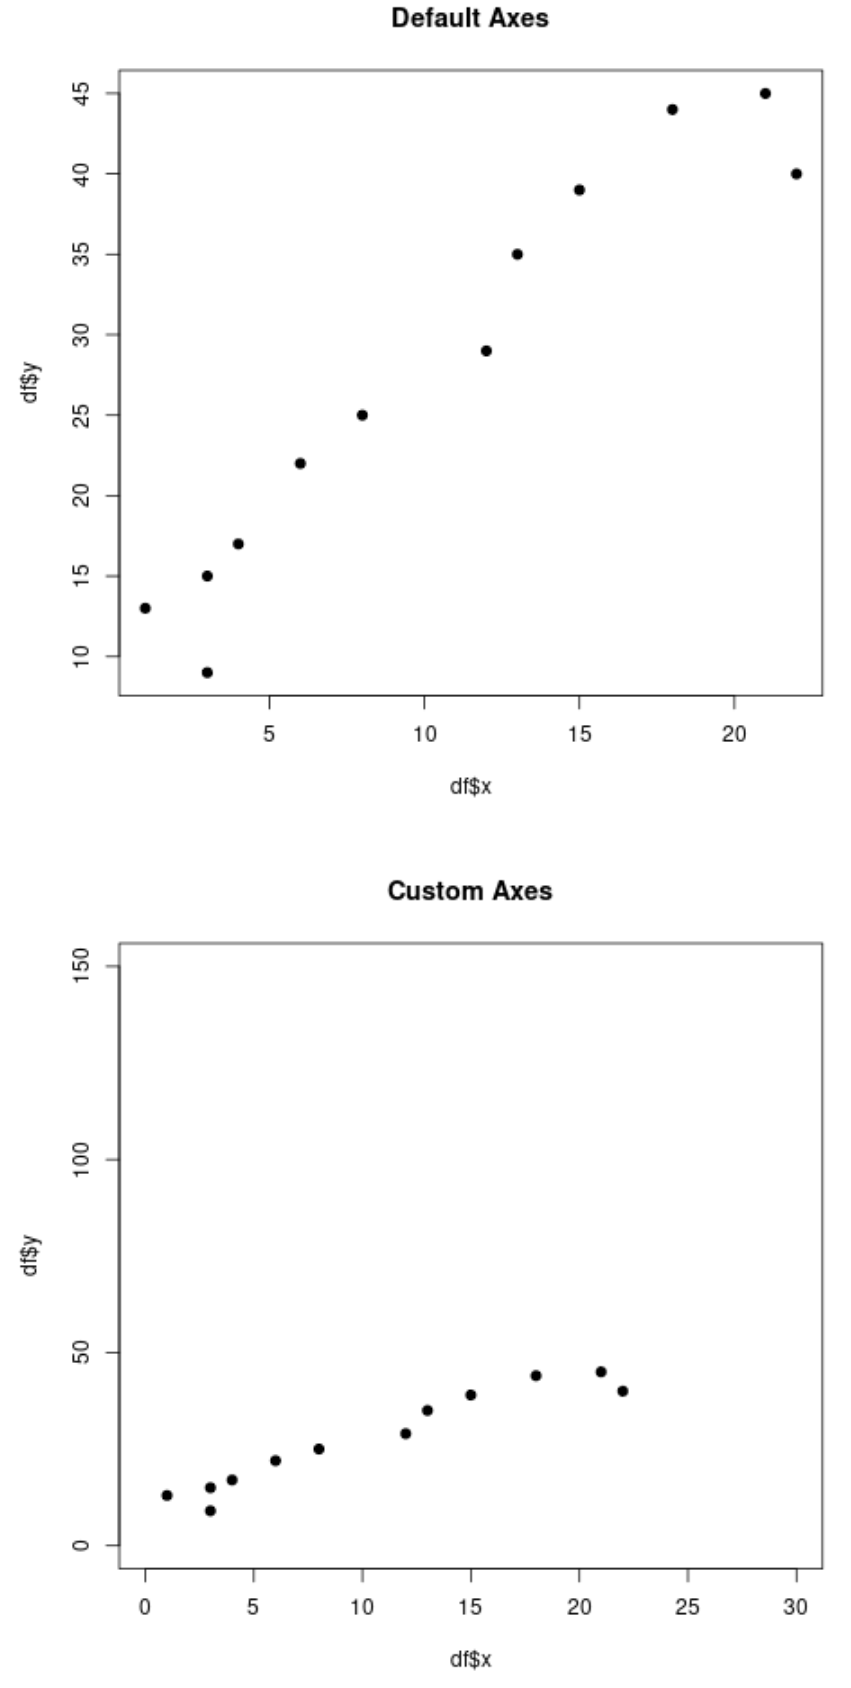
要更改基于 R 的绘图上的轴比例,可以使用xlim()和ylim()函数。
下面的代码展示了如何在实践中使用这些函数:
 #define data
df <- data. frame (x=c(1, 3, 3, 4, 6, 8, 12, 13, 15, 18, 21, 22),
                 y=c(13, 15, 9, 17, 22, 25, 29, 35, 39, 44, 45, 40))

#create plot with default axis scales
plot(df$x, df$y, pch=19, main=' Default Axes ')

#create plot with custom axis scales
plot(df$x, df$y, pch=19, xlim=c(0.30), ylim=c(0.150), main=' Custom Axes ')

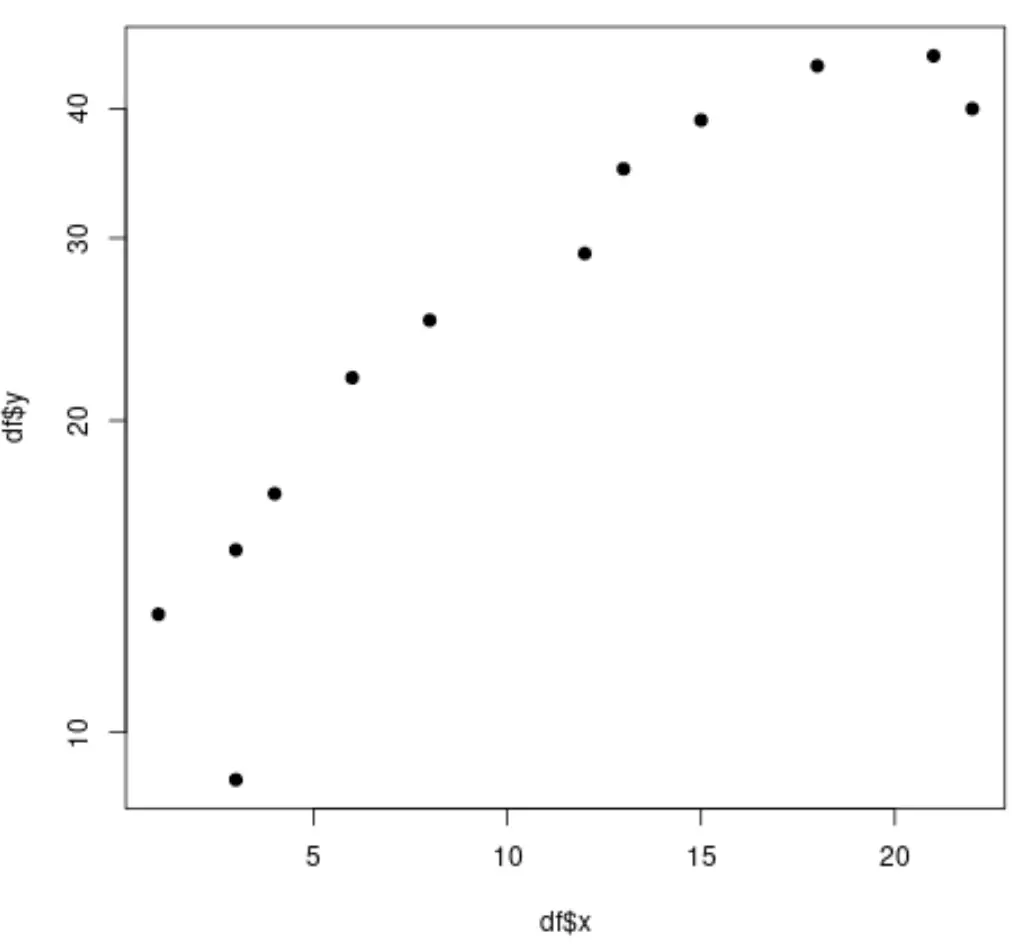
请注意,您还可以使用log参数快速将其中一个轴转换为对数刻度。例如,以下代码显示如何将 Y 轴转换为对数刻度:
 #define data
df <- data. frame (x=c(1, 3, 3, 4, 6, 8, 12, 13, 15, 18, 21, 22),
                 y=c(13, 15, 9, 17, 22, 25, 29, 35, 39, 44, 45, 40))

#create plot with log y-axis
plot(df$x, df$y, log=' y ', pch=19)

示例 2:更改 ggplot2 中的轴比例
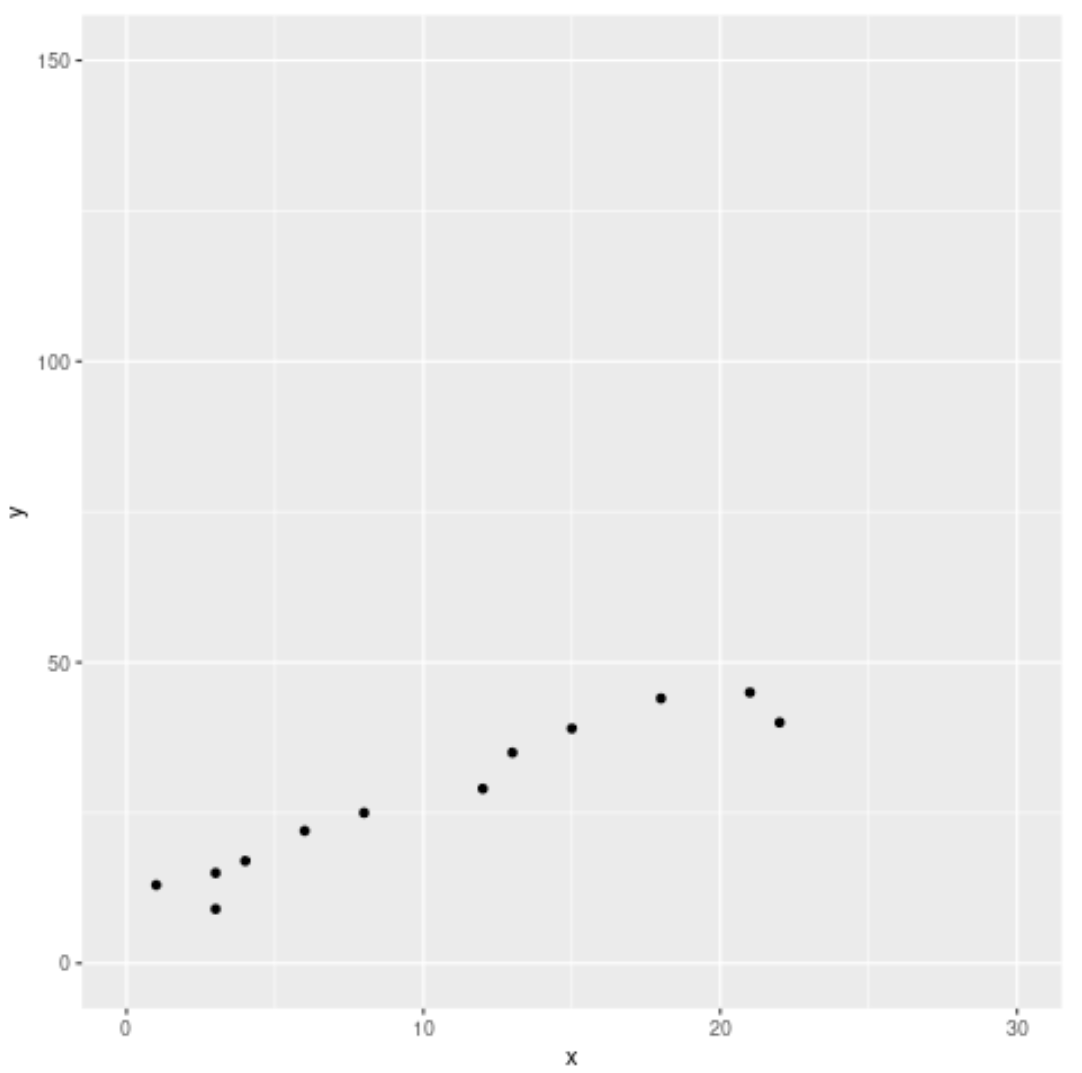
要更改基于 R 的绘图上的轴刻度,您还可以使用xlim()和ylim()函数来更改轴刻度
下面的代码展示了如何在实践中使用这些函数:
 library (ggplot2)

#define data
df <- data. frame (x=c(1, 3, 3, 4, 6, 8, 12, 13, 15, 18, 21, 22),
                 y=c(13, 15, 9, 17, 22, 25, 29, 35, 39, 44, 45, 40))

#create scatterplot with custom axes
ggplot(data=df, aes(x=x, y=y)) +
  geom_point() +
  xlim(0, 30) +
  ylim(0, 150)

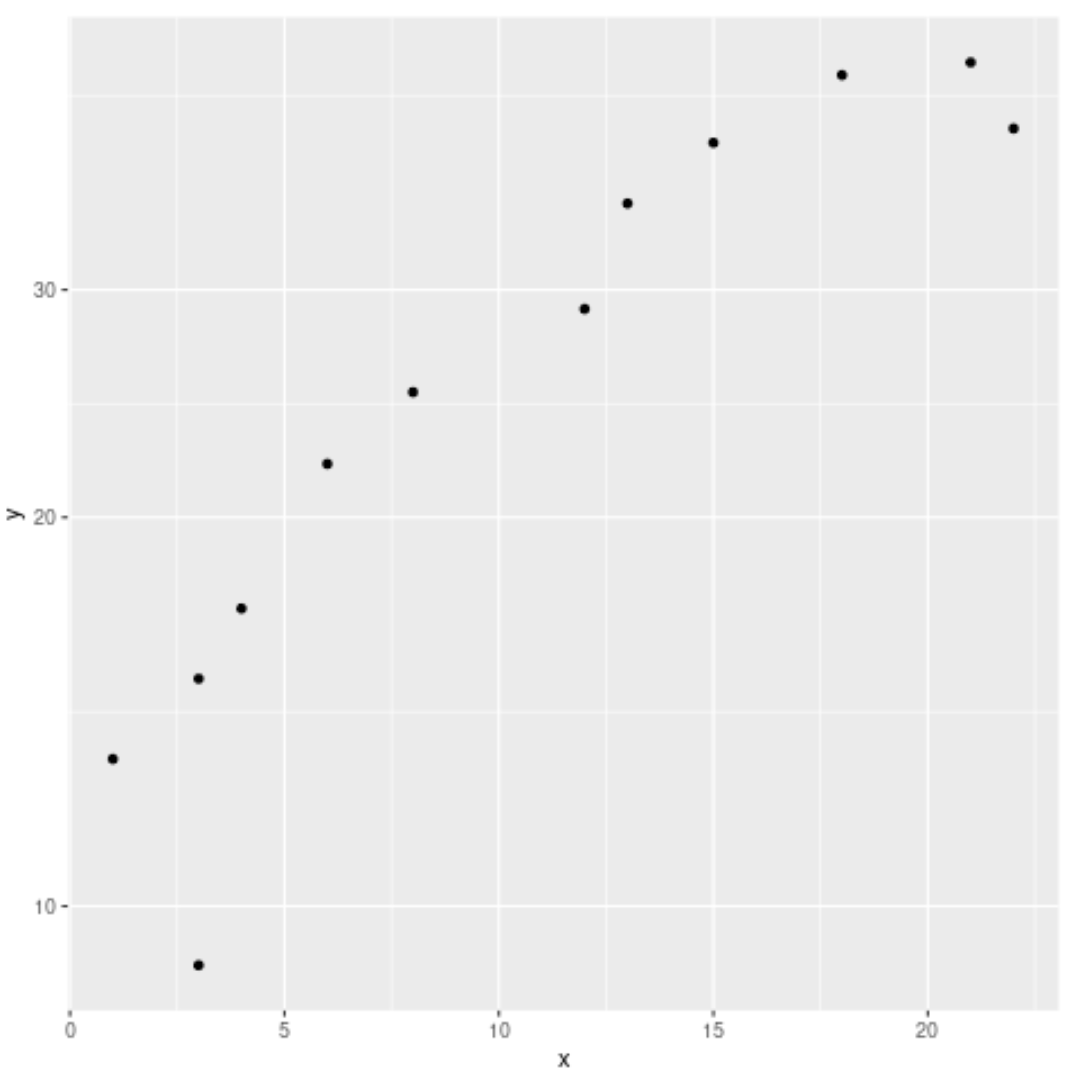
我们还可以使用以下参数将任一轴转换为对数刻度:
- scale_x_连续(trans=’log10′)
- scale_y_连续(trans=’log10′)
例如,以下代码显示如何将 Y 轴转换为对数刻度:
 library (ggplot2)

#define data
df <- data. frame (x=c(1, 3, 3, 4, 6, 8, 12, 13, 15, 18, 21, 22),
                 y=c(13, 15, 9, 17, 22, 25, 29, 35, 39, 44, 45, 40))

#create scatterplot with log y-axis
ggplot(data=df, aes(x=x, y=y)) +
  geom_point() +
  scale_y_continuous(trans=' log10 ')

您可以在此页面找到更多 R 数据可视化教程。