如何创建具有相关系数的 seaborn 散点图
您可以使用以下基本语法在 Seaborn 中创建散点图并向图中添加相关系数:
 import scipy
import matplotlib. pyplot as plt
import seaborn as sns

#calculate correlation coefficient between x and y
r = scipy. stats . pearsonr (x=df. x , y=df. y )[0]

#create scatterplot
sns. scatterplot (data=df, x=df. x , y=df. y )

#add correlation coefficient to plot
plt. text (5, 30, ' r = ' + str ( round (r,2)))
以下示例展示了如何在实践中使用此语法。
示例:创建具有相关系数的 Seaborn 散点图
假设我们有以下 pandas DataFrame,它显示了各种篮球运动员的得分和助攻:
 import pandas as pd

#createDataFrame
df = pd. DataFrame ({' team ': ['A', 'A', 'A', 'A', 'B', 'C', 'C', 'C', 'D', 'D'],
                   ' points ': [12, 11, 18, 15, 14, 20, 25, 24, 32, 30],
                   ' assists ': [4, 7, 7, 8, 9, 10, 10, 12, 10, 15]})

#view DataFrame
print (df)

  team points assists
0 to 12 4
1 to 11 7
2 To 18 7
3 to 15 8
4 B 14 9
5 C 20 10
6 C 25 10
7 C 24 12
8 D 32 10
9 D 30 15
我们可以使用以下语法创建散点图来可视化通道和点之间的关系,并使用scipy的pearsonr()函数来计算这两个变量之间的相关系数:
 import scipy
import matplotlib. pyplot as plt
import seaborn as sns

#calculate correlation coefficient between assists and points
r = scipy. stats . pearsonr (x=df. assists , y=df. points )[0]

#create scatterplot
sns. scatterplot (data=df, x=df. assists , y=df. points )

#add correlation coefficient to plot
plt. text (5, 30, ' r = ' + str ( round (r,2)))
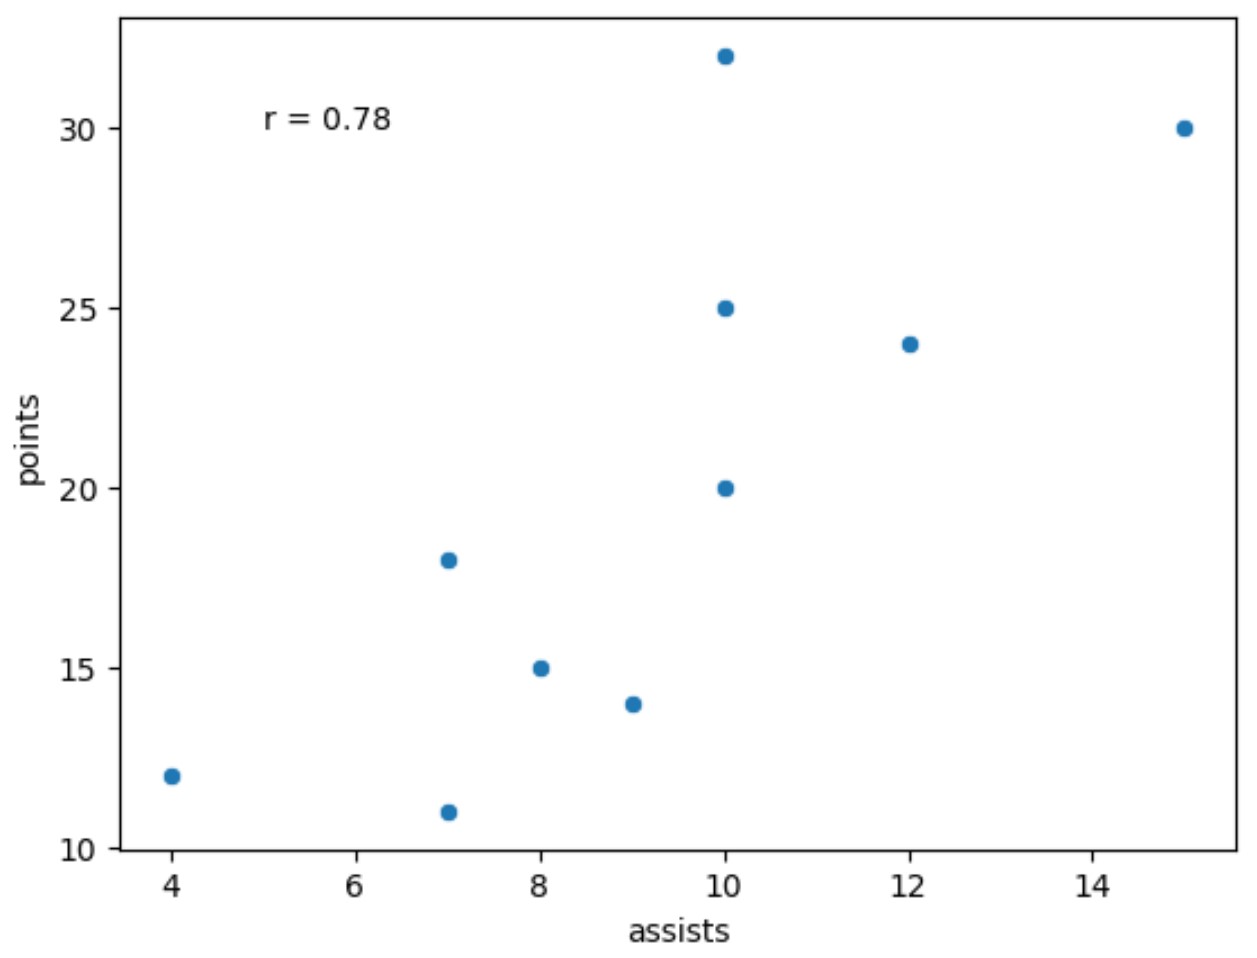
从结果中我们可以看出,助攻数与得分之间的皮尔逊相关系数为0.78 。
请注意,我们使用round()函数将相关系数四舍五入到小数点后两位。
您可以随意四舍五入到不同的小数位数,也可以随意使用fontsize参数来更改绘图上相关系数的字体大小:
 import scipy
import matplotlib. pyplot as plt
import seaborn as sns

#calculate correlation coefficient between assists and points
r = scipy. stats . pearsonr (x=df. assists , y=df. points )[0]

#create scatterplot
sns. scatterplot (data=df, x=df. assists , y=df. points )

#add correlation coefficient to plot
plt. text (5, 30, ' r= '+ str ( round (r,4)), fontsize= 20 ))
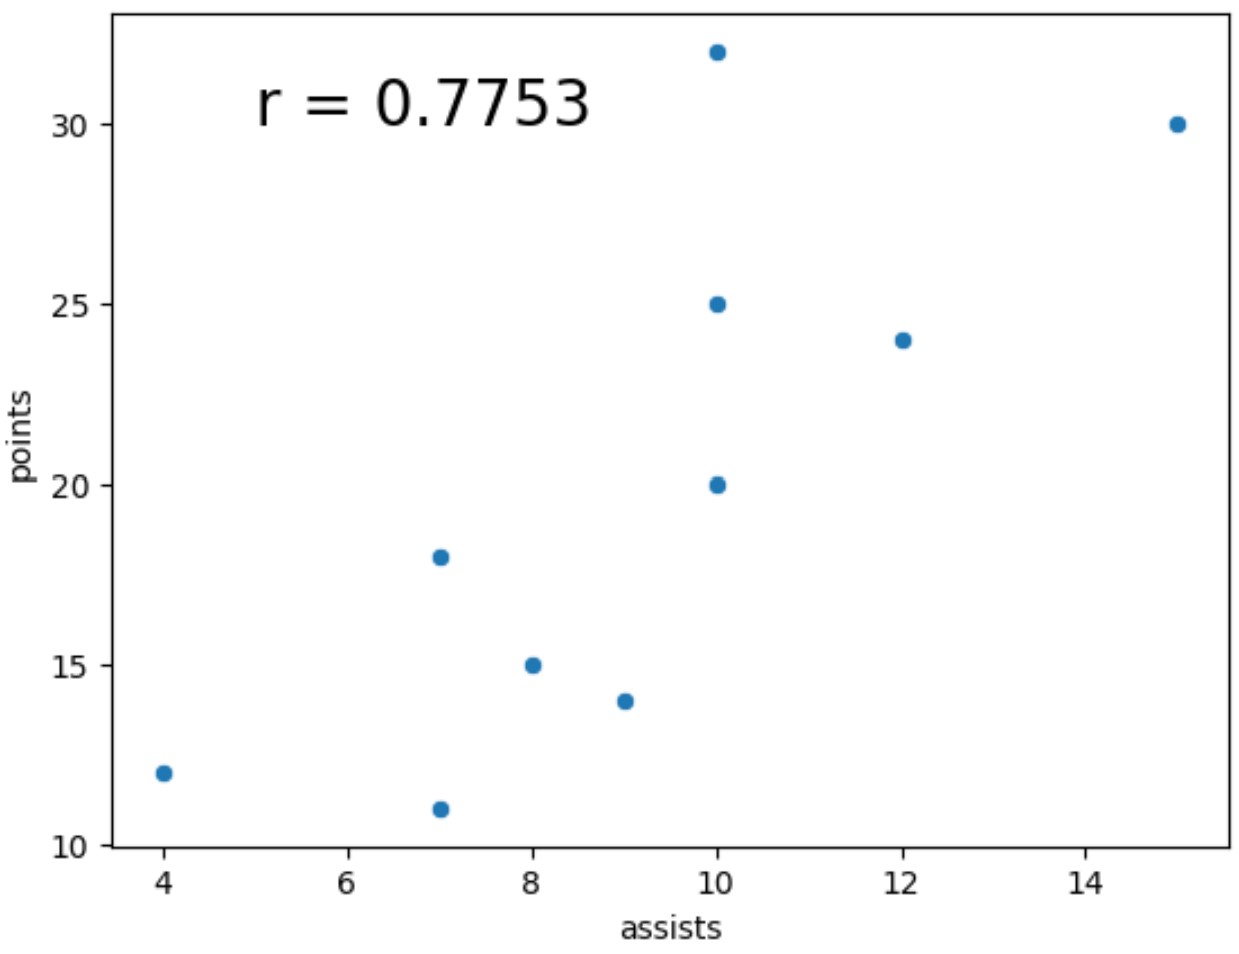
请注意,相关系数现在四舍五入到小数点后四位,并且字体大小比前面的示例大得多。
注意:您可以在此处找到 seaborn scatterplot()函数的完整文档。
其他资源
以下教程解释了如何在seaborn中执行其他常见功能:
如何在 Seaborn 中绘制分布
如何在 Seaborn 中对 x 轴上的箱线图进行排序
如何将表格添加到 Seaborn 图中
关于作者
本杰明·安德森博
大家好,我是本杰明,一位退休的统计学教授,后来成为 Statorials 的热心教师。 凭借在统计领域的丰富经验和专业知识,我渴望分享我的知识,通过 Statorials 增强学生的能力。了解更多