如何在 ggplot2 中删除图例(附示例)
您可以使用以下语法从 ggplot2 的图中删除图例:
 ggplot(df, aes (x=x, y=y, color=z)) +
  geom_point() +
  theme( legend.position =" none ")
通过指定legend.position=”none” ,您将告诉 ggplot2 从图中删除所有图例。
以下分步示例展示了如何在实践中使用此语法。
第 1 步:创建数据框
首先,我们创建一个数据框:
 #create data frame
df <- data. frame (assists=c(3, 4, 4, 3, 1, 5, 6, 7, 9),
                 points=c(14, 8, 8, 16, 3, 7, 17, 22, 26),
                 position=rep(c('Guard', 'Forward', 'Center'), times= 3 ))

#view data frame
df

  assist points position
1 3 14 Guard
2 4 8 Forward
3 4 8 Center
4 3 16 Guard
5 1 3 Forward
6 5 7 Center
7 6 17 Guard
8 7 22 Forward
9 9 26 Center
第 2 步:使用 ggplot2 创建绘图
接下来,让我们使用 ggplot2 创建一个简单的散点图:
 library (ggplot2)

#create scatterplot
ggplot(df, aes (x=assists, y=points, color=position)) +
  geom_point(size= 3 )
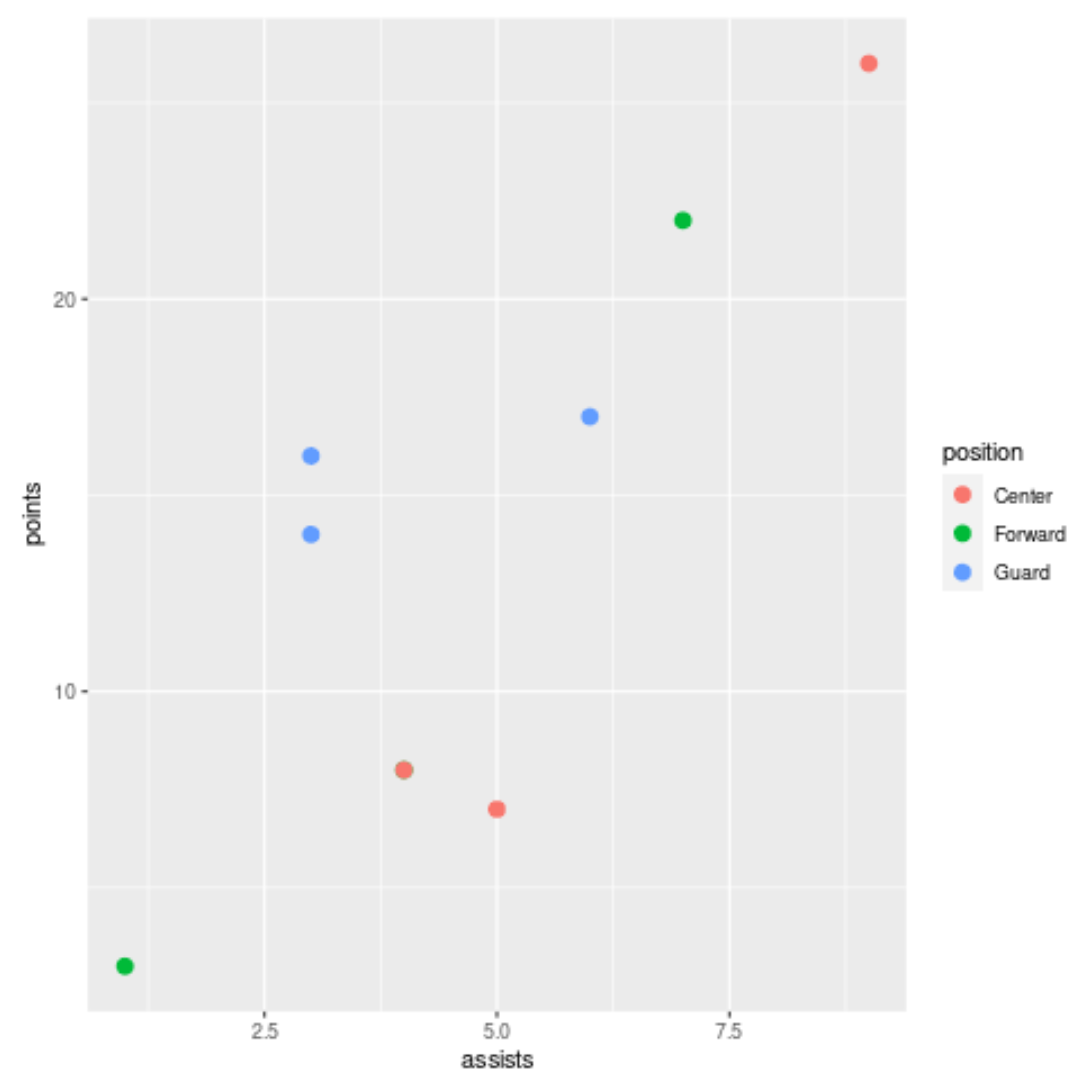
默认情况下,ggplot2 包含一个图例,以便更轻松地解释散点图中的颜色。
第 3 步:删除图例
接下来,让我们使用legend.position=”none”从图中删除图例:
 library (ggplot2)

#create scatterplot with no legend
ggplot(df, aes (x=assists, y=points, color=position)) +
  geom_point(size= 3 ) +
  theme( legend.position =" none ")
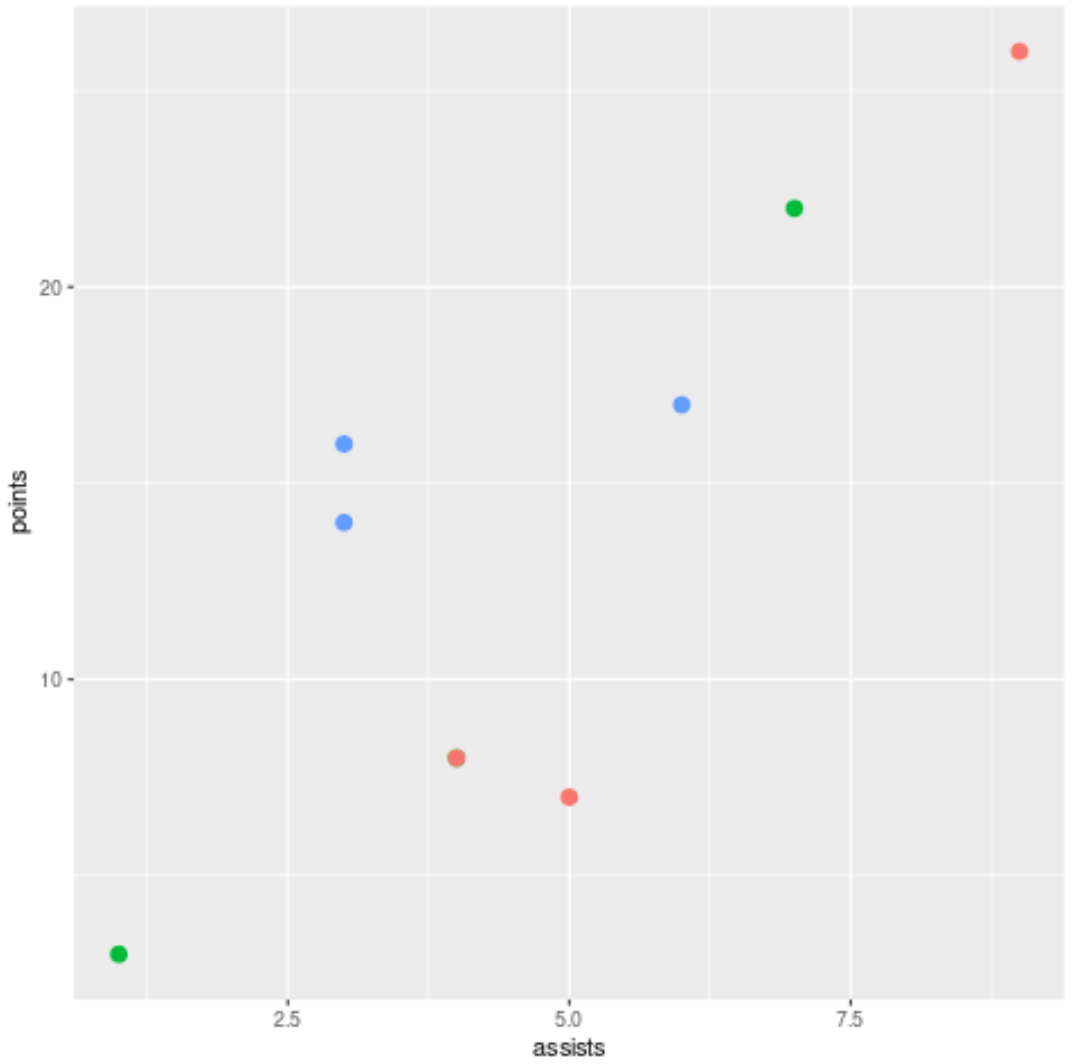
这个传说被完全从情节中删除了。
其他资源
以下教程解释了如何在ggplot2中执行其他常见操作:
关于作者
本杰明·安德森博
大家好,我是本杰明,一位退休的统计学教授,后来成为 Statorials 的热心教师。 凭借在统计领域的丰富经验和专业知识,我渴望分享我的知识,通过 Statorials 增强学生的能力。了解更多