如何在 matplotlib 中使用fig.add_subplot
您可以使用以下基本语法在 Matplotlib 中创建子图:
 import matplotlib. pyplot as plt

#define figure
fig = plt. figure ()

#add first subplot in layout that has 3 rows and 2 columns
fig. add_subplot (321)

#add fifth subplot in layout that has 3 rows and 2 columns
fig. add_subplot (325)

...
以下示例展示了如何在实践中使用此语法。
示例 1:添加具有统一布局的子图
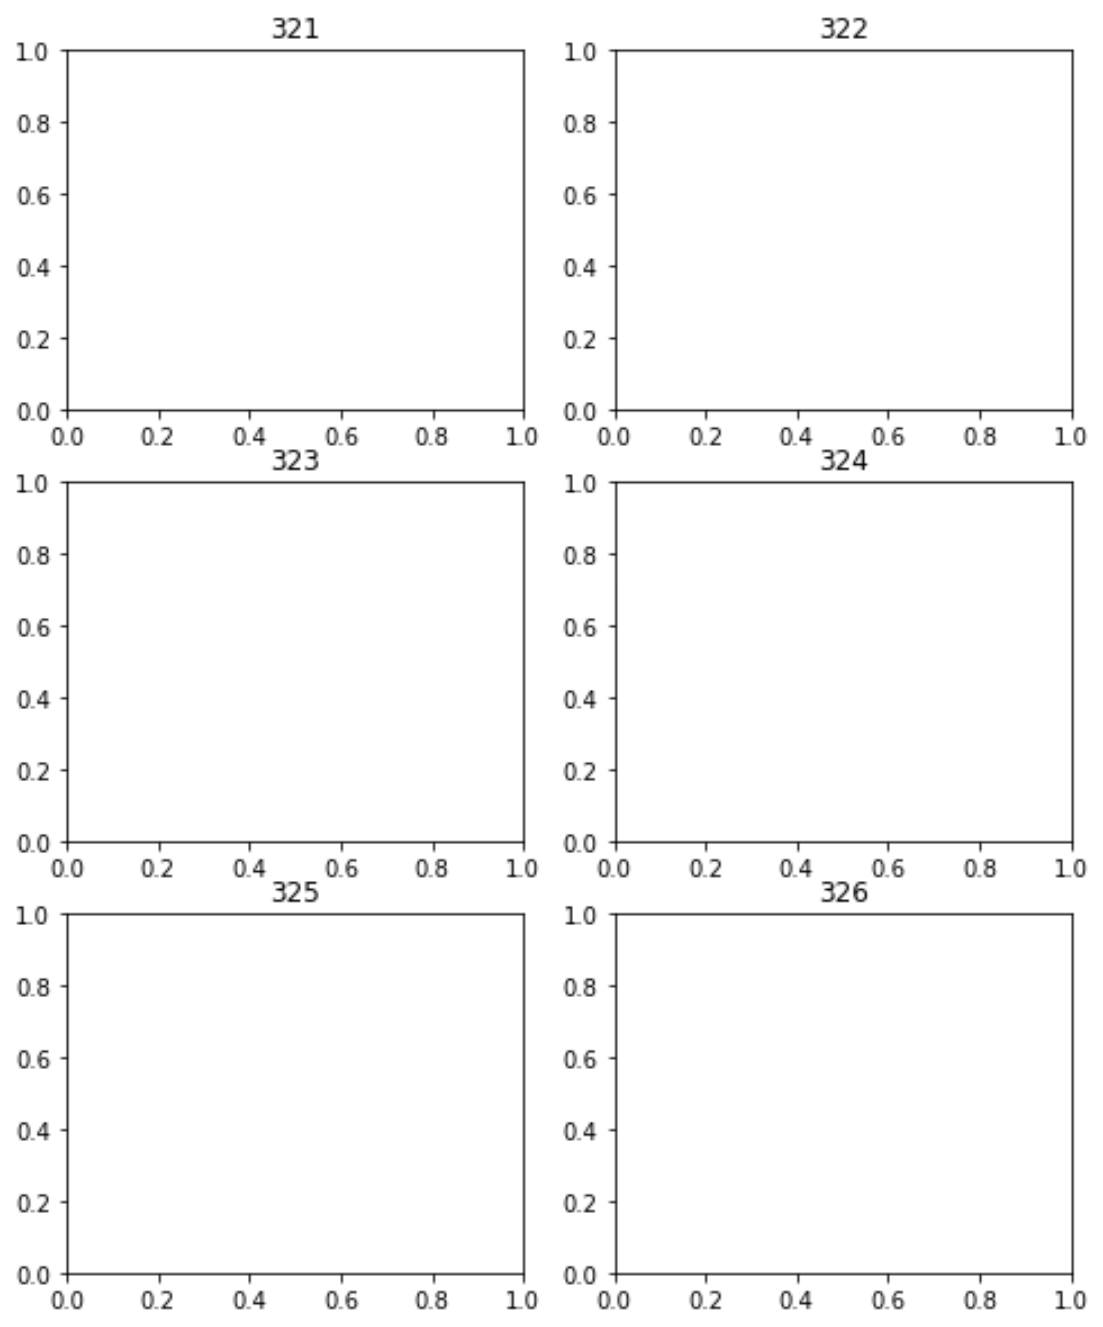
以下代码演示了如何在 3 行 2 列的布局中创建 6 个子图:
 import matplotlib. pyplot as plt

#define figure
fig = plt. figure ()

#add subplots
fig. add_subplot (321). set_title (' 321 ')
fig. add_subplot (322). set_title (' 322 ')
fig. add_subplot (323). set_title (' 323 ')
fig. add_subplot (324). set_title (' 324 ')
fig. add_subplot (325). set_title (' 325 ')
fig. add_subplot (326). set_title (' 326 ')

#display plots
plt. show ()

请注意,结果是在 3 行 2 列的布局中显示 6 个子图。
示例 2:添加布局不均匀的子图
以下代码显示了如何创建四个子图,如下所示:
- 其中三个图是在 3 行 2 列的网格中创建的。
- 第四个图是在 1 行 2 列的网格中创建的。
 import matplotlib. pyplot as plt

#define figure
fig = plt. figure ()

#add subplots
fig. add_subplot (321). set_title (' 321 ')
fig. add_subplot (323). set_title (' 323 ')
fig. add_subplot (325). set_title (' 325 ')
fig. add_subplot (122). set_title (' 122 ')

#display plots
plt. show ()

最终结果是在 3×2 网格中显示三个子图,而最后一个子图在 1×2 网格中显示。
其他资源
以下教程解释了如何在 Matplotlib 中执行其他常见操作:
如何调整 Matplotlib 子图之间的间距
如何在 Matplotlib 中调整子图大小
如何在 Matplotlib 中为子图添加标题