如何在 matplotlib 中绘制圆(附示例)
您可以使用Circle()函数快速将圆添加到 Matplotlib 中的绘图中,该函数使用以下语法:
matplotlib.patches.Circle(xy, 半径=5)
金子:
- xy:圆的坐标(x,y)
- 半径:圆的半径。默认值为 5。
本教程展示了该功能实际使用的几个示例:
示例 1:创建单个圆
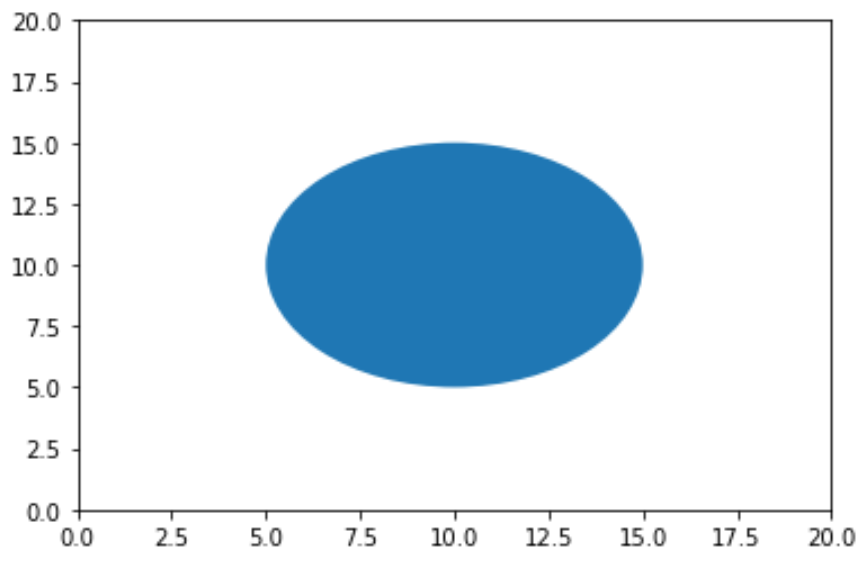
以下代码演示了如何在位于坐标 (x,y)(10,10) 的 Matplotlib 图上创建单个圆:
 import matplotlib. pyplot as plt

#set axis limits of plot (x=0 to 20, y=0 to 20)
plt. axis ([0, 20, 0, 20])

#create circle with (x, y) coordinates at (10, 10)
c=plt. Circle ((10, 10))

#add circle to plot (gca means "get current axis")
plt. gca (). add_artist (c)

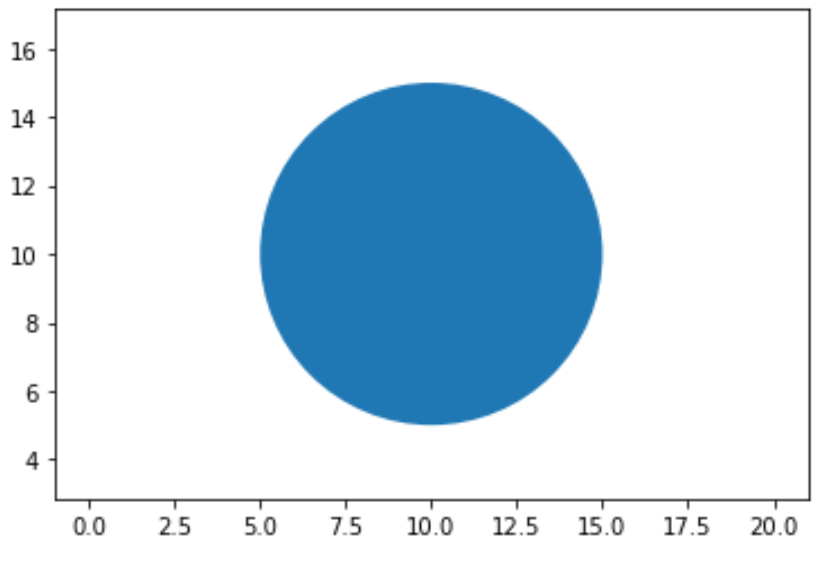
默认情况下,Matplotlib 图的轴通常每单位数据显示更多像素。要使圆显示为圆而不是椭圆,必须使用plt.axis(“equal”)参数,如下所示:
 import matplotlib. pyplot as plt

#set axis limits of plot (x=0 to 20, y=0 to 20)
plt. axis ([0, 20, 0, 20])
plt. axis (" equal ")

#create circle with (x, y) coordinates at (10, 10)
c=plt. Circle ((10, 10))

#add circle to plot (gca means "get current axis")
plt. gca (). add_artist (c)

示例 2:创建多个圆圈
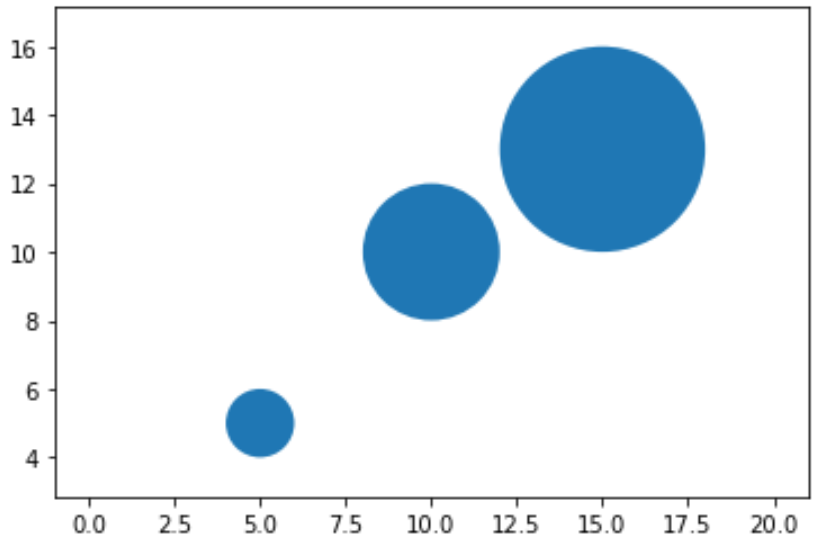
以下代码显示了如何在 Matplotlib 绘图上创建多个圆圈:
 import matplotlib. pyplot as plt

#set axis limits of plot (x=0 to 20, y=0 to 20)
plt. axis ([0, 20, 0, 20])
plt. axis (" equal ")

#define circles
c1=plt. Circle ((5, 5), radius= 1 )
c2=plt. Circle ((10, 10), radius= 2 )
c3=plt. Circle ((15, 13), radius= 3 )

#add circles to plot
plt. gca (). add_artist (c1)
plt. gca (). add_artist (c2)
plt. gca (). add_artist (c3)

示例 3:更改圆的外观
您可以使用以下参数来更改 Matplotlib 中圆的外观:
- radius:指定圆的半径
- color:指定圆的颜色
- alpha:指定圆的透明度
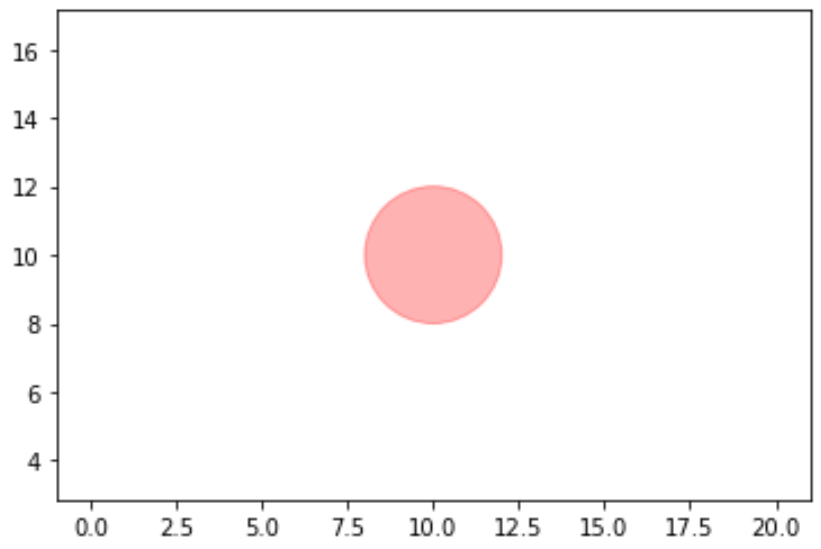
以下代码显示了如何同时使用其中多个参数的示例:
 import matplotlib. pyplot as plt

#set axis limits of plot (x=0 to 20, y=0 to 20)
plt. axis ([0, 20, 0, 20])
plt. axis (" equal ")

#create circle with (x, y) coordinates at (10, 10)
c=plt. Circle ((10, 10), radius= 2 , color=' red ', alpha= .3 )

#add circle to plot (gca means "get current axis")
plt. gca (). add_artist (c)

请注意,您还可以使用自定义十六进制颜色代码来指定圆圈的颜色。