如何在 python 中绘制卡方分布
要在 Python 中绘制卡方分布,您可以使用以下语法:
 #x-axis ranges from 0 to 20 with .001 steps
x = np. arange (0, 20, 0.001)

#plot Chi-square distribution with 4 degrees of freedom
plt. plot (x, chi2. pdf (x, df= 4 ))
x数组定义 x 轴的范围, plt.plot()生成具有指定自由度的卡方分布图。
以下示例展示了如何在实践中使用这些功能。
示例 1:绘制单个卡方分布
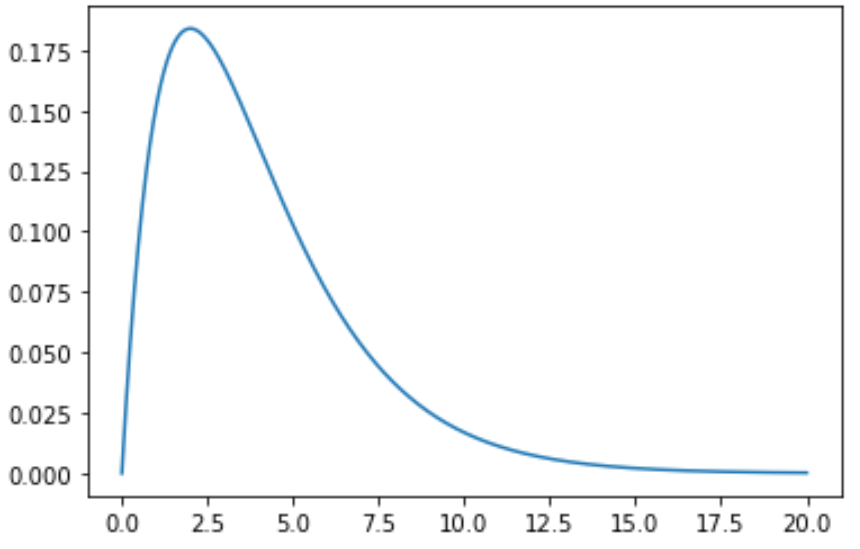
以下代码展示了如何绘制具有 4 个自由度的单个卡方分布曲线
 import numpy as np
import matplotlib. pyplot as plt
from scipy. stats import chi2

#x-axis ranges from 0 to 20 with .001 steps
x = np. arange (0, 20, 0.001)

#plot Chi-square distribution with 4 degrees of freedom
plt. plot (x, chi2. pdf (x, df= 4 ))

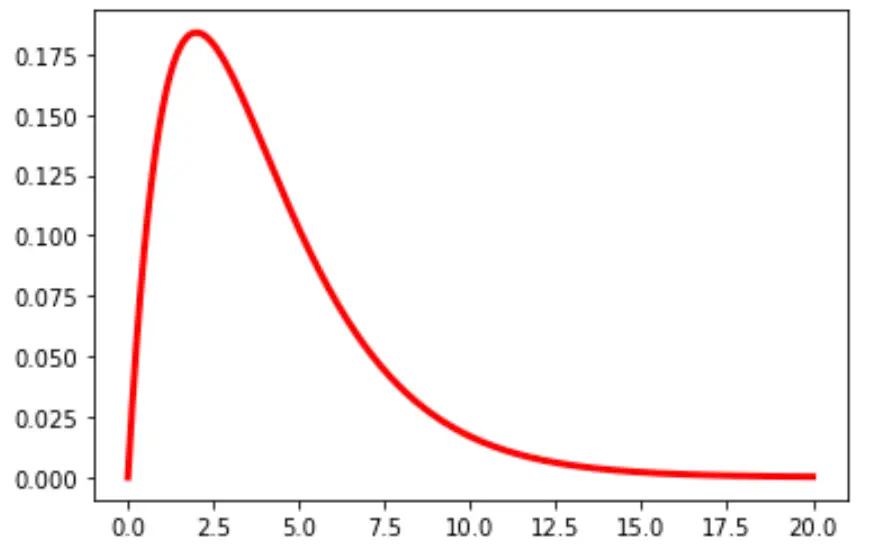
您还可以更改图表中线条的颜色和宽度:
plt. plot (x, chi2. pdf (x, df= 4 ), color=' red ', linewidth= 3 )

示例 2:绘制多个卡方分布
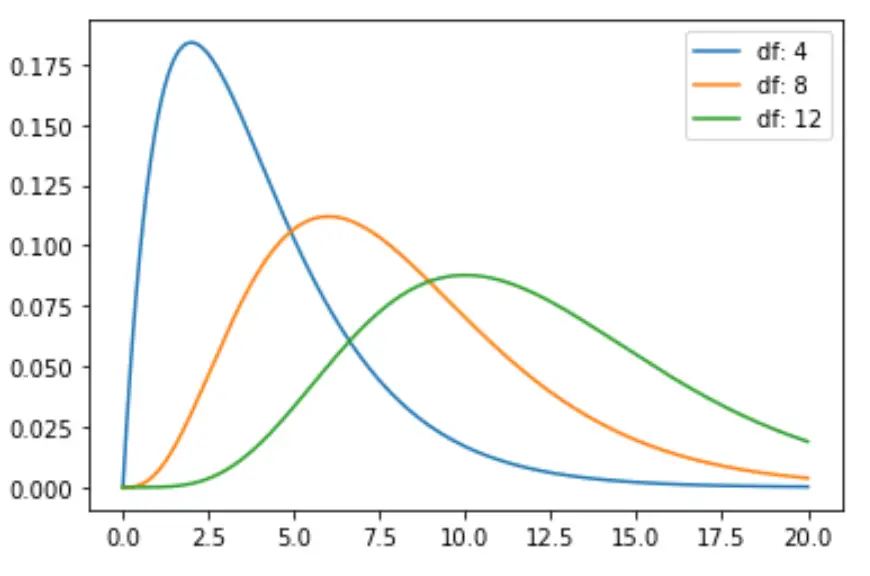
以下代码展示了如何绘制具有不同自由度的多条卡方分布曲线:
 import numpy as np
import matplotlib. pyplot as plt
from scipy. stats import chi2

#x-axis ranges from 0 to 20 with .001 steps
x = np. arange (0, 20, 0.001)

#define multiple Chi-square distributions
plt. plot (x, chi2. pdf (x, df= 4 ), label=' df: 4 ')
plt. plot (x, chi2. pdf (x, df= 8 ), label=' df: 8 ')
plt. plot (x, chi2. pdf (x, df= 12 ), label=' df: 12 ')

#add legend to plot
plt. legend ()

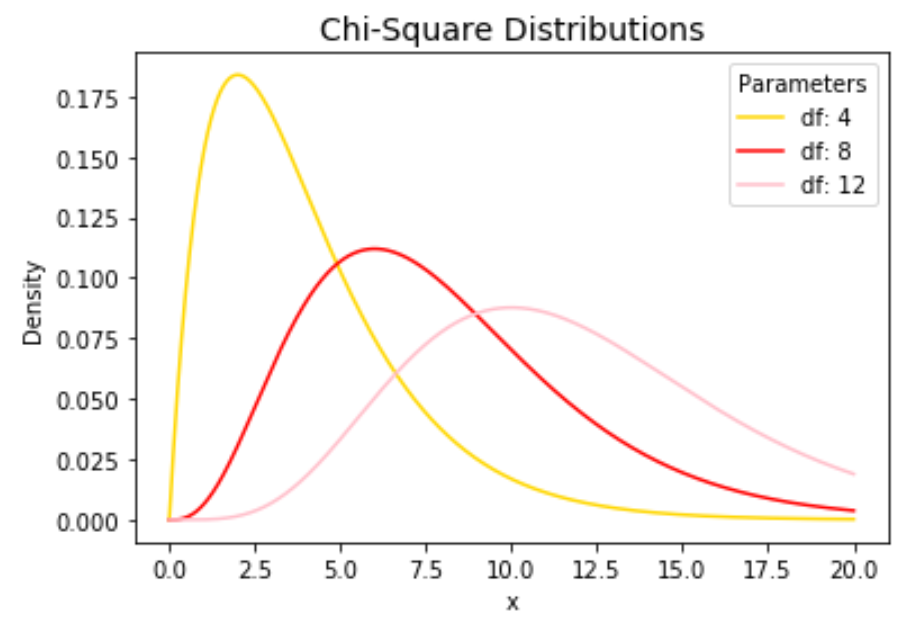
您可以随意更改线条颜色并添加标题和轴标签来完成图表:
 import numpy as np
import matplotlib. pyplot as plt
from scipy. stats import chi2

#x-axis ranges from 0 to 20 with .001 steps
x = np. arange (0, 20, 0.001)

#define multiple Chi-square distributions
plt. plot (x, chi2. pdf (x, df= 4 ), label=' df: 4 ', color=' gold ')
plt. plot (x, chi2. pdf (x, df= 8 ), label=' df: 8 ', color=' red ')
plt. plot (x, chi2. pdf (x, df= 12 ), label=' df: 12 ', color=' pink ')

#add legend to plot
plt. legend (title=' Parameters ')

#add axes labels and a title
plt. ylabel (' Density ')
plt. xlabel (' x ')
plt. title (' Chi-Square Distributions ', fontsize= 14 )

有关plt.plot()函数的详细说明,请参阅matplotlib 文档。