如何使用 scikit-learn 执行多项式回归
当预测变量和响应变量之间的关系是非线性时,可以使用多项式回归技术。
这种类型的回归采用以下形式:
Y = β 0 + β 1 X + β 2 X 2 + … + β h
其中h是多项式的“次数”。
以下分步示例展示了如何使用 sklearn 在 Python 中执行多项式回归。
第 1 步:创建数据
首先,我们创建两个 NumPy 数组来保存预测变量和响应变量的值:
 import matplotlib. pyplot as plt
import numpy as np

#define predictor and response variables
x = np. array ([2, 3, 4, 5, 6, 7, 7, 8, 9, 11, 12])
y = np. array ([18, 16, 15, 17, 20, 23, 25, 28, 31, 30, 29])

#create scatterplot to visualize relationship between x and y
plt. scatter (x,y)

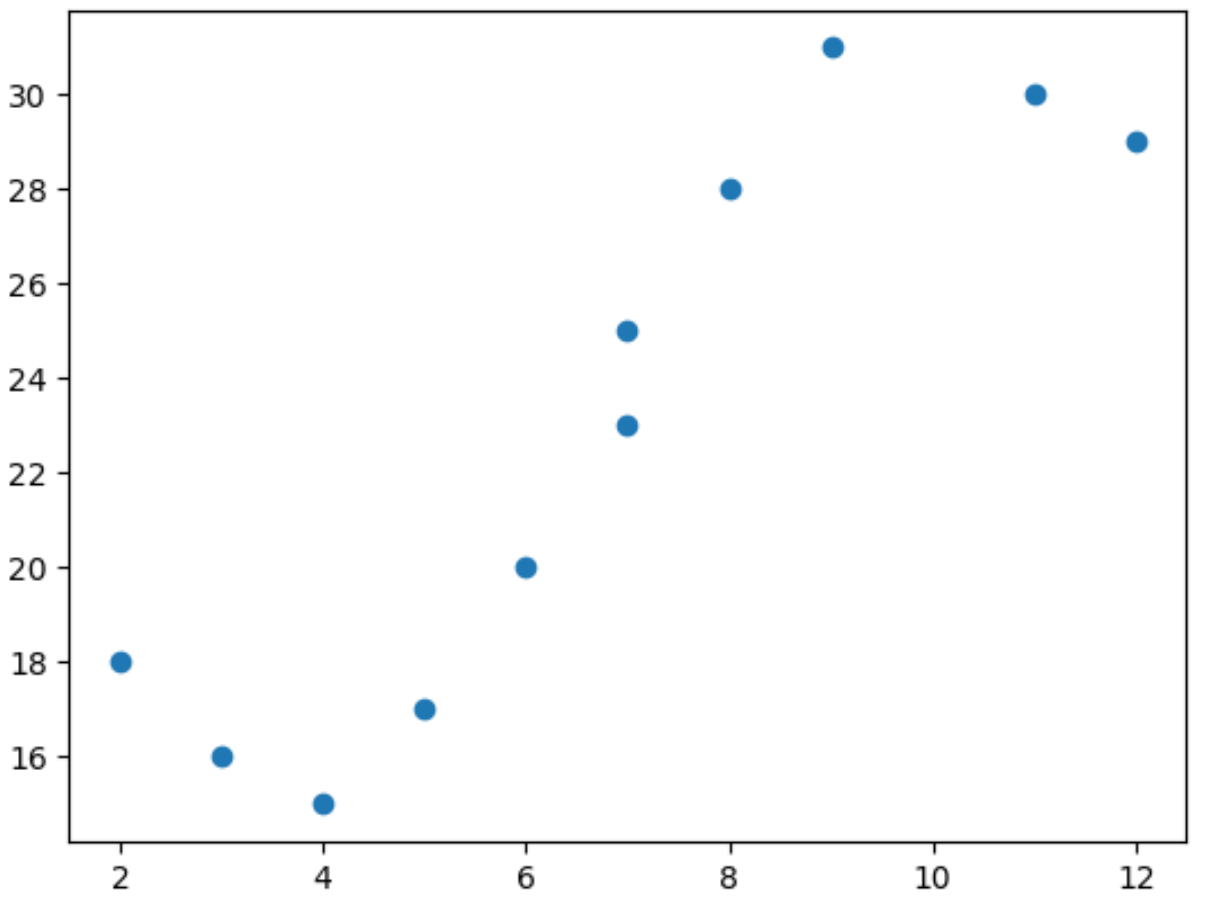
从散点图中,我们可以看到x和y之间的关系不是线性的。
因此,最好将多项式回归模型拟合到数据以捕获两个变量之间的非线性关系。
步骤 2:拟合多项式回归模型
以下代码展示了如何使用 sklearn 函数来拟合此数据集的 3 次多项式回归模型:
 from sklearn. preprocessing import PolynomialFeatures
from sklearn. linear_model import LinearRegression

#specify degree of 3 for polynomial regression model
#include bias=False means don't force y-intercept to equal zero
poly = PolynomialFeatures(degree= 3 , include_bias= False )

#reshape data to work properly with sklearn
poly_features = poly. fit_transform ( x.reshape (-1, 1))

#fit polynomial regression model
poly_reg_model = LinearRegression()
poly_reg_model. fit (poly_features,y)

#display model coefficients
print (poly_reg_model. intercept_ , poly_reg_model. coef_ )

33.62640037532282 [-11.83877127 2.25592957 -0.10889554]
使用最后一行显示的模型系数,我们可以编写拟合的多项式回归方程如下:
y = -0.109x 3 + 2.256x 2 – 11.839x + 33.626
在给定预测变量的给定值的情况下,该方程可用于查找响应变量的期望值。
例如,如果 x 为 4,则响应变量 y 的预期值为 15.39:
y = -0.109(4) 3 + 2.256(4) 2 – 11.839(4) + 33.626= 15.39
注意:要拟合具有不同阶数的多项式回归模型,只需更改PolynomialFeatures()函数中阶数参数的值即可。
步骤 3:可视化多项式回归模型
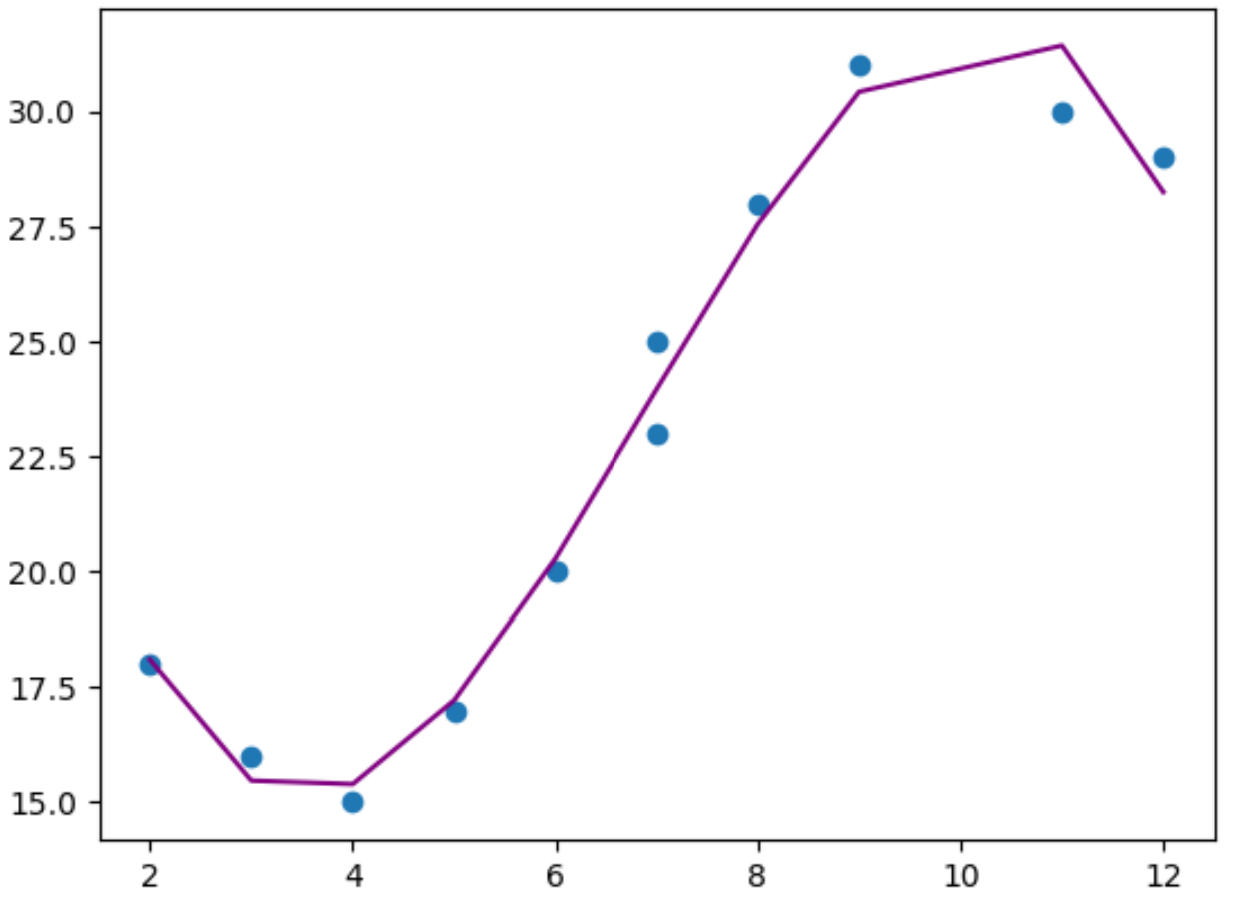
最后,我们可以创建一个简单的图来可视化拟合原始数据点的多项式回归模型:
 #use model to make predictions on response variable
y_predicted = poly_reg_model. predict (poly_features)

#create scatterplot of x vs. y
plt. scatter (x,y)

#add line to show fitted polynomial regression model
plt. plot (x,y_predicted,color=' purple ')

从图中我们可以看到,多项式回归模型似乎很好地拟合了数据,没有出现过拟合的情况。
注意:您可以在此处找到 sklearn PolynomialFeatures()函数的完整文档。
其他资源
以下教程解释了如何使用 sklearn 执行其他常见任务: