Pandas:如何在子图中绘制多个 dataframe
您可以使用以下基本语法在子图中绘制多个 pandas DataFrame:
 import matplotlib. pyplot as plt

#define subplot layout
fig, axes = plt. subplots (nrows= 2 , ncols= 2 )

#add DataFrames to subplots
df1. plot (ax=axes[0,0])
df2. plot (ax=axes[0,1])
df3. plot (ax=axes[1,0])
df4. plot (ax=axes[1,1])
以下示例展示了如何在实践中使用此语法。
示例:在子图中绘制多个 Pandas DataFrame
假设我们有四个 panda DataFrame,其中包含有关四个不同零售商店的销售和退货信息:
 import pandas as pd

#create four DataFrames
df1 = pd. DataFrame ({' sales ': [2, 5, 5, 7, 9, 13, 15, 17, 22, 24],
                    ' returns ': [1, 2, 3, 4, 5, 6, 7, 8, 7, 5]})

df2 = pd. DataFrame ({' sales ': [2, 5, 11, 18, 15, 15, 14, 9, 6, 7],
                    ' returns ': [1, 2, 0, 2, 2, 4, 5, 4, 2, 1]})

df3 = pd. DataFrame ({' sales ': [6, 8, 8, 7, 8, 9, 10, 7, 8, 12],
                    ' returns ': [1,0, 1, 1, 1, 2, 3, 2, 1, 3]})

df4 = pd. DataFrame ({' sales ': [10, 7, 7, 6, 7, 6, 4, 3, 3, 2],
                    ' returns ': [4, 4, 3, 3, 2, 3, 2, 1, 1, 0]})
我们可以使用以下语法在具有 2 行和 2 列布局的子图中绘制每个 DataFrame:
 import matplotlib. pyplot as plt

#define subplot layout
fig, axes = plt. subplots (nrows= 2 , ncols= 2 )

#add DataFrames to subplots
df1. plot (ax=axes[0,0])
df2. plot (ax=axes[0,1])
df3. plot (ax=axes[1,0])
df4. plot (ax=axes[1,1])

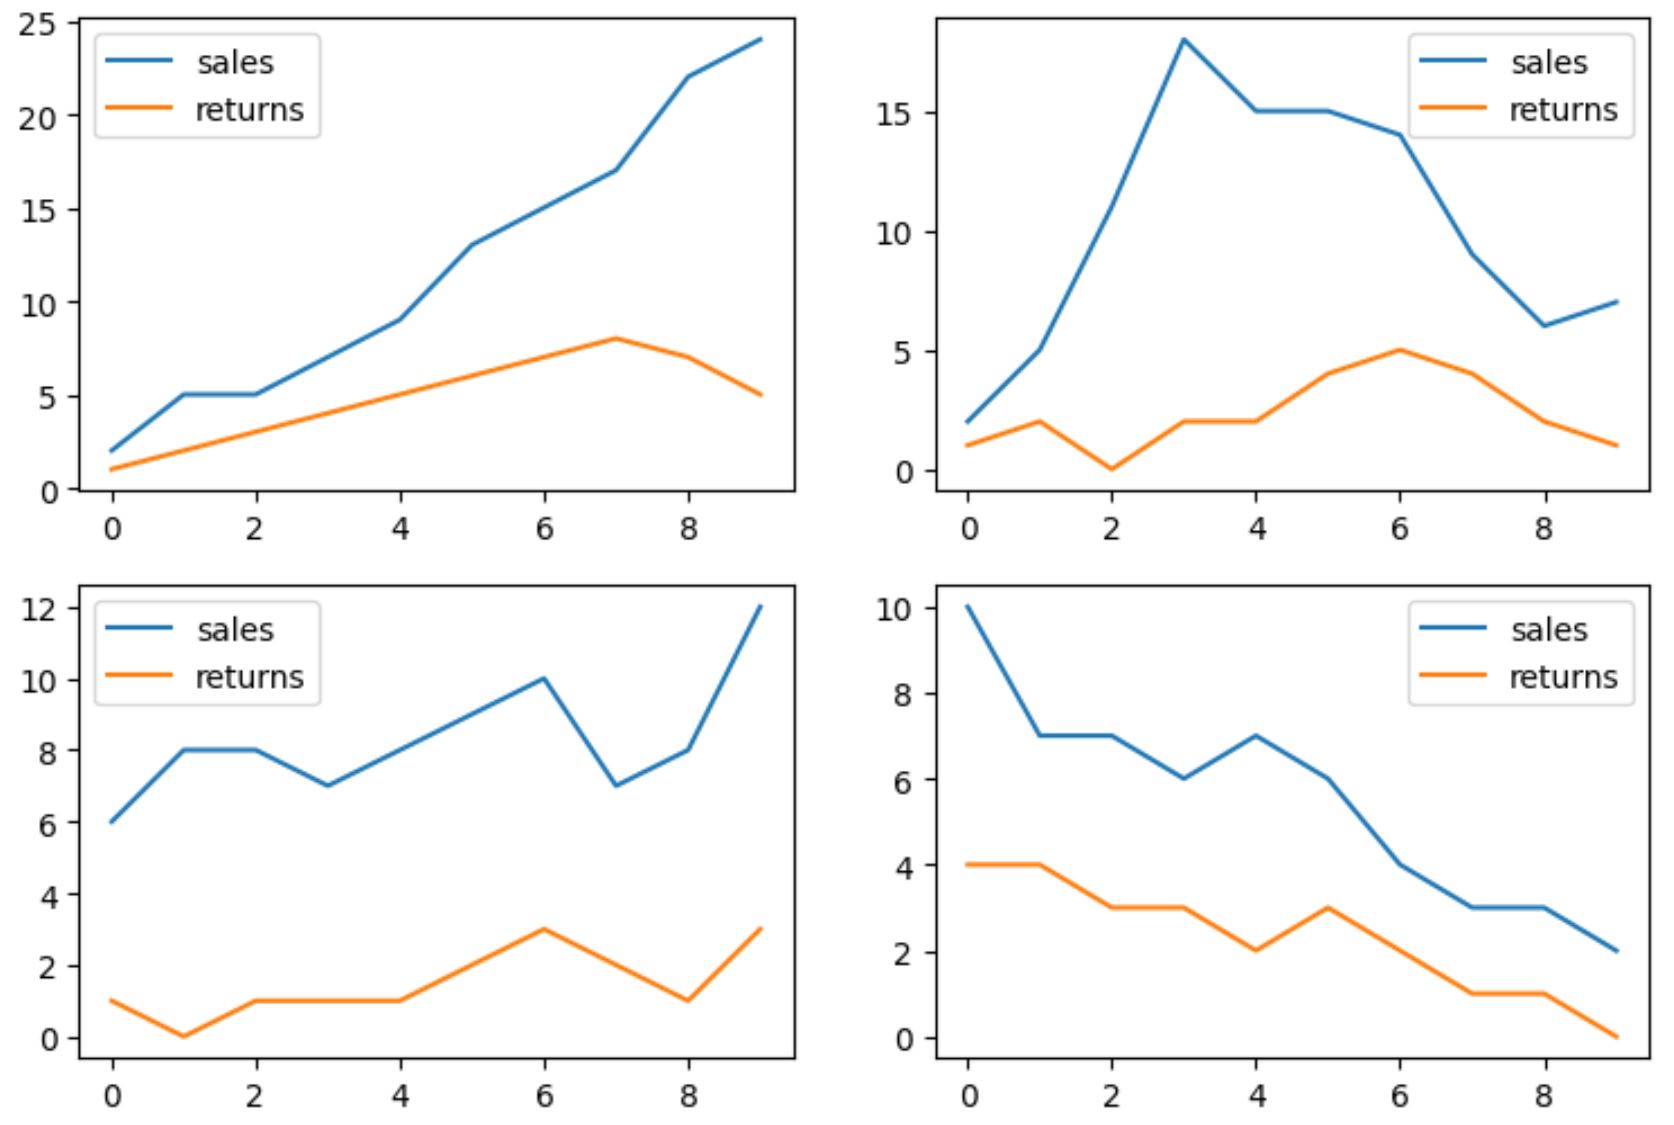
四个数据帧中的每一个都显示在子图中。
请注意,我们使用axes参数来指定每个DataFrame的放置位置。
例如,名为df1的 DataFrame 被放置在行索引值为0 、列索引值为0的位置(例如左上角的子图)。
另请注意,您可以使用nrows和ncols参数更改子图的布局。
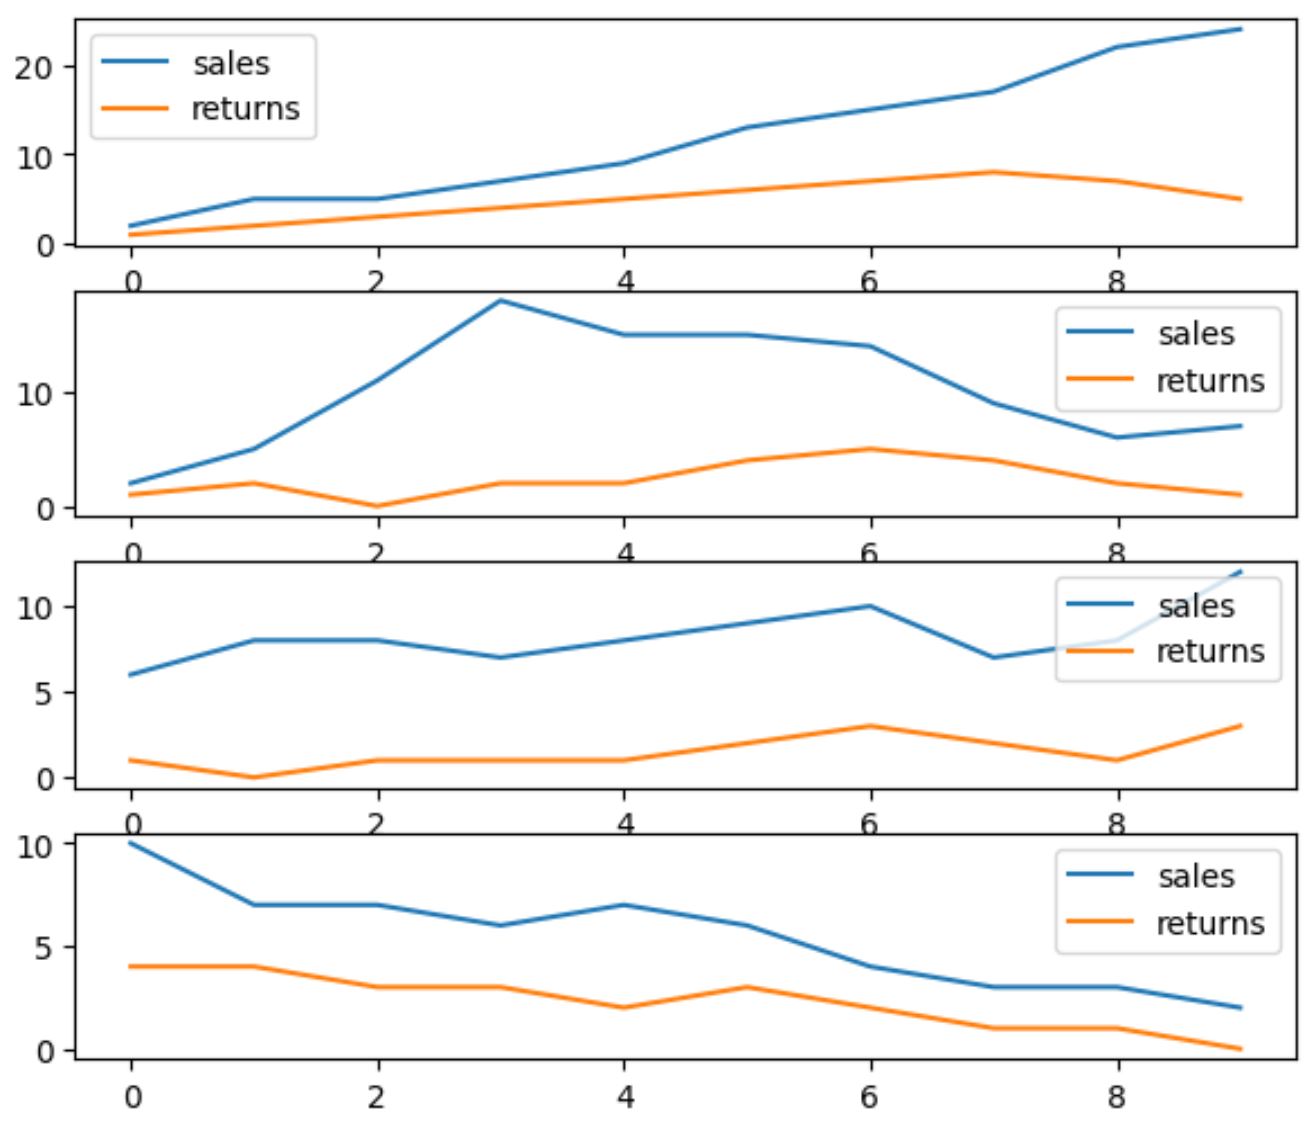
例如,以下代码显示如何将子图组织为四行一列:
 import matplotlib. pyplot as plt

#define subplot layout
fig, axes = plt. subplots (nrows= 4 , ncols= 1 )

#add DataFrames to subplots
df1. plot (ax=axes[0])
df2. plot (ax=axes[1])
df3. plot (ax=axes[2])
df4. plot (ax=axes[3])

子图现在以四行一列的布局排列。
请注意,如果您希望子图在 y 轴和 x 轴上具有相同的比例,则可以使用sharey和sharex参数。
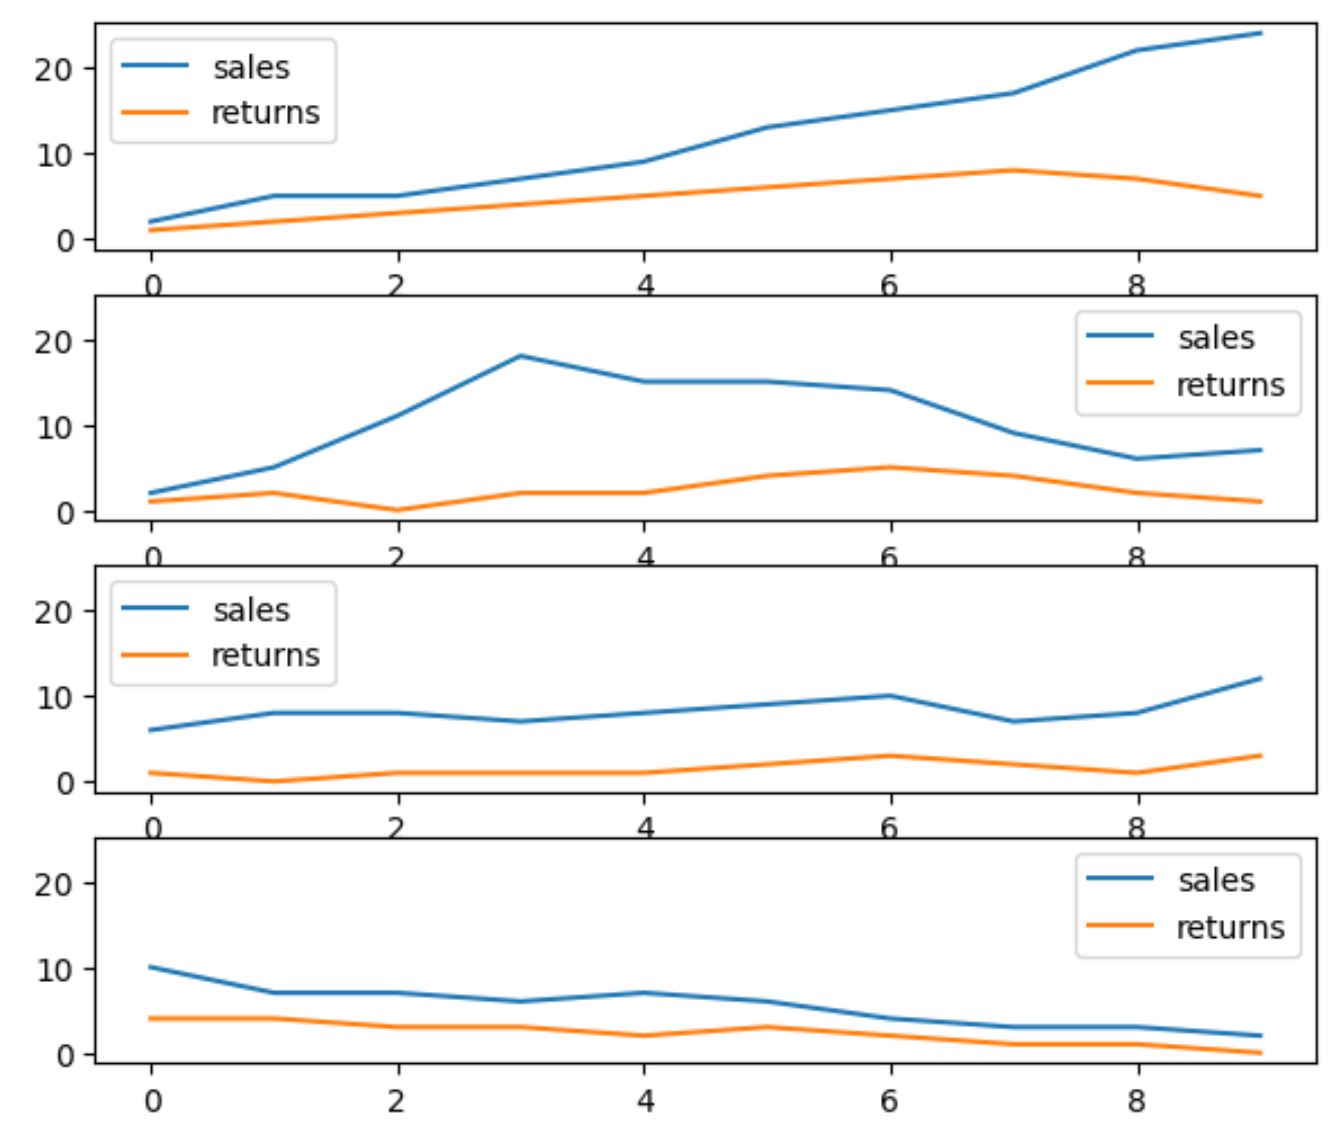
例如,以下代码显示如何使用sharey参数强制所有子图在 Y 轴上具有相同的比例:
 import matplotlib. pyplot as plt

#define subplot layout, force subplots to have same y-axis scale
fig, axes = plt. subplots (nrows= 4 , ncols= 1 , sharey= True )

#add DataFrames to subplots
df1. plot (ax=axes[0])
df2. plot (ax=axes[1])
df3. plot (ax=axes[2])
df4. plot (ax=axes[3])

请注意,每个子图的 Y 轴现在范围从 0 到 20。
其他资源
以下教程解释了如何在 pandas 中执行其他常见操作:
如何从 Pandas DataFrame 创建饼图
如何从 Pandas DataFrame 创建点云
如何从 Pandas DataFrame 创建直方图