学生 t 分布
本文解释了 Student t 分布是什么以及它的用途。此外,还显示了 Student t 分布图以及此类概率分布的特征。
什么是学生分布?
学生 t 分布是统计学中广泛使用的概率分布。具体来说,学生 t 分布在学生 t 检验中用于确定两个样本均值之间的差异并建立置信区间。
Student t 分布是由统计学家 William Sealy Gosset 于 1908 年以笔名“Student”开发的。
Student t 分布由其自由度数定义,自由度数是通过从观测总数中减去 1 个单位而获得的。因此,确定 Student t 分布自由度的公式为ν=n-1 。
![\begin{array}{c}\nu=n-1\\[2ex]X\sim t_\nu\end{array}](https://statorials.org/wp-content/ql-cache/quicklatex.com-1c805dc2d6ca050feb70dad99de53402_l3.png "Rendered by QuickLaTeX.com")
学生 t 分布图
现在我们知道了 Student t 分布的定义,让我们看看它的图是什么。因此,您可以在下面以图形方式看到具有不同自由度的 Student t 分布的几个示例。
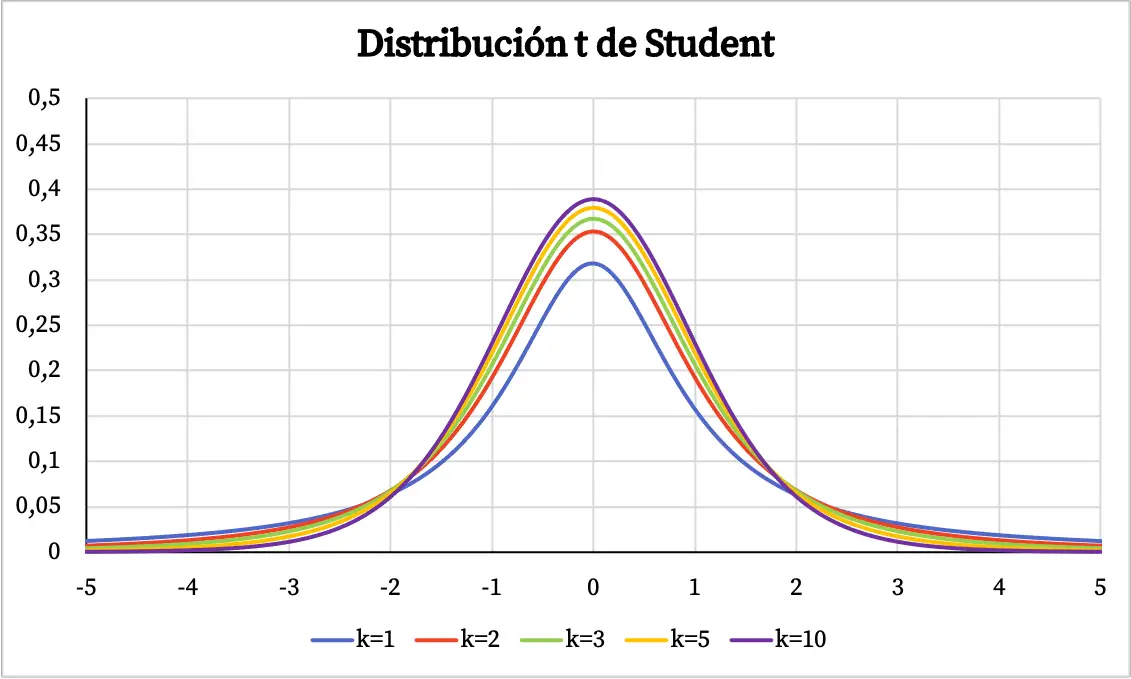
从 Student t 分布图中,可以推导出以下属性:
- Student t 分布以 0 为中心对称,呈钟形。
- Student’s t 分布比正态分布更加分散,即 Student’s t 分布的曲线更宽。
- Student t 分布的自由度越大,其离散度越低。
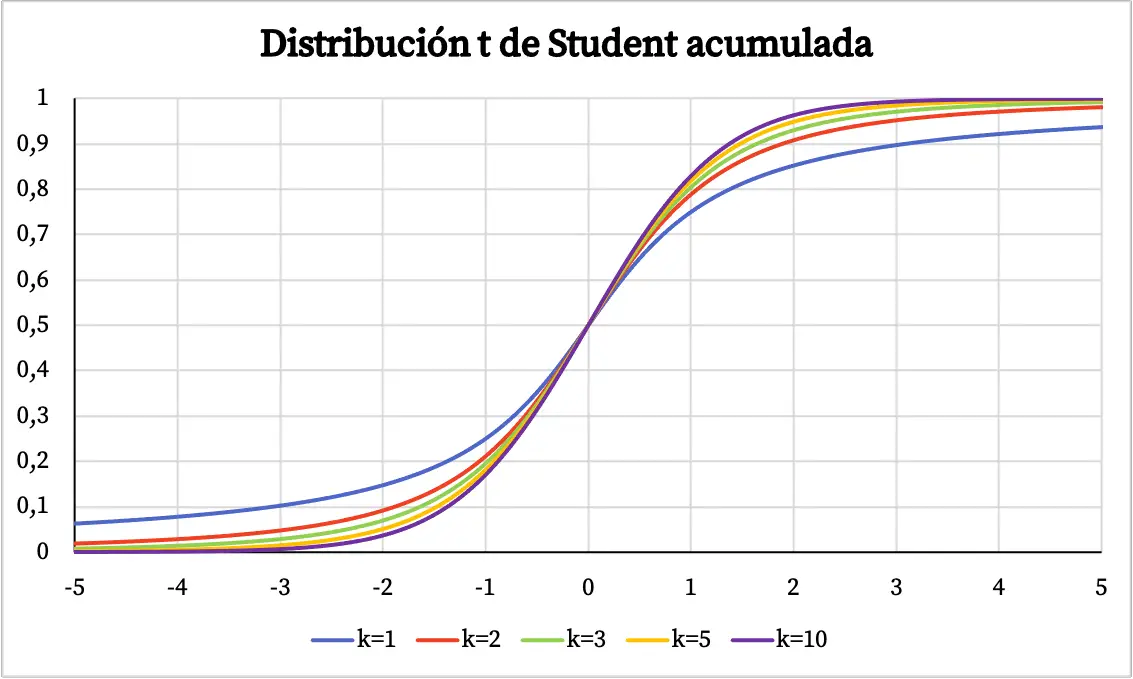
在上图中,已根据学生 t 分布的自由度绘制了密度函数。但是,您可以在下面看到学生 t 分布的累积概率函数如何变化:
学生 t 分布的特征
学生 t 分布最重要的特征如下所示。
- Student t 分布的域由实数组成。

- 对于具有多个自由度的 Student t 分布,分布的均值等于 0。
![\begin{array}{c}X\sim t_\nu\\[2ex] E[X]=0 \qquad \text{para }\nu>1\end{array} ” title=”Rendered by QuickLaTeX.com” height=”55″ width=”190″ style=”vertical-align: 0px;”></p>
</p>
<ul>
<li>学生 t 分布的方差可以使用以下表达式计算:</li>
</ul>
<p class=](https://statorials.org/wp-content/ql-cache/quicklatex.com-d4fed5eadcaa1162752aeedb7f8a0906_l3.png)
![\begin{array}{c}X\sim t_\nu\\[2ex] Var(X)=\cfrac{\nu}{\nu-2} \qquad \text{para }\nu>2\end{array} ” title=”Rendered by QuickLaTeX.com” height=”75″ width=”245″ style=”vertical-align: 0px;”></p>
</p>
<ul>
<li>无论自由度有多少,Student t 分布的中位数和众数始终为 0。</li>
</ul>
<p class=](https://statorials.org/wp-content/ql-cache/quicklatex.com-bfdcbc8a5f071a61e091b0ef6f686a16_l3.png)
![\begin{array}{c}Me=0\\[2ex]Mo=0\end{array}](https://statorials.org/wp-content/ql-cache/quicklatex.com-8d90790fce0c987648c0b30216c82214_l3.png "Rendered by QuickLaTeX.com")
- Student t 分布的密度函数由以下公式定义:
![\displaystyle P[X=x]=\frac{\Gamma((\nu+1)/2)} {\sqrt{\nu\pi}\,\Gamma(\nu/2)} (1+x^2/\nu)^{-(\nu+1)/2}](https://statorials.org/wp-content/ql-cache/quicklatex.com-8c0f1e97a8e407e8b9e2b00ba93aee0e_l3.png "Rendered by QuickLaTeX.com")
- Student t 分布的累积概率分布函数由以下公式定义:
![\displaystyle P[X\leq x]=\frac{1}{2} + x \Gamma \left( \frac{\nu+1}{2} \right) \cdot\frac{\,_2F_1 \left ( \frac{1}{2},\frac{\nu+1}{2};\frac{3}{2};-\frac{x^2}{\nu} \right)}{\sqrt{\pi\nu}\,\Gamma \left(\frac{\nu}{2}\right)}](https://statorials.org/wp-content/ql-cache/quicklatex.com-da1e3bdf2d87c3a7dcc89c236958dcec_l3.png "Rendered by QuickLaTeX.com")
- 对于自由度大于 3 的 Student t 分布,不对称系数为零,因为它是对称分布。
 学生 t 分布的应用
学生 t 分布是统计学中广泛使用的概率分布。事实上,甚至还有学生 t 检验,用于检验假设和置信区间。
因此,学生 t 分布使我们能够分析两个样本均值之间的差异,更准确地说,它用于确定两个样本是否具有显着不同的均值。同样,Student’s t 检验用于确定线性回归分析获得的直线是否有斜率。
简而言之,Student t 分布的应用依赖于对理论上遵循正态分布的数据集的分析,但观察总数太小而无法使用这种类型的分布。
关于作者
本杰明·安德森博
大家好,我是本杰明,一位退休的统计学教授,后来成为 Statorials 的热心教师。 凭借在统计领域的丰富经验和专业知识,我渴望分享我的知识,通过 Statorials 增强学生的能力。了解更多