如何在 python 中绘制最佳拟合线(附示例)
您可以使用以下基本语法在 Python 中绘制最佳拟合线:
 #find line of best fit
a, b = np. polyfit (x, y, 1)

#add points to plot
plt. scatter (x,y)

#add line of best fit to plot
plt. plot (x, a*x+b)
以下示例展示了如何在实践中使用此语法。
示例 1:在 Python 中绘制最佳拟合基线
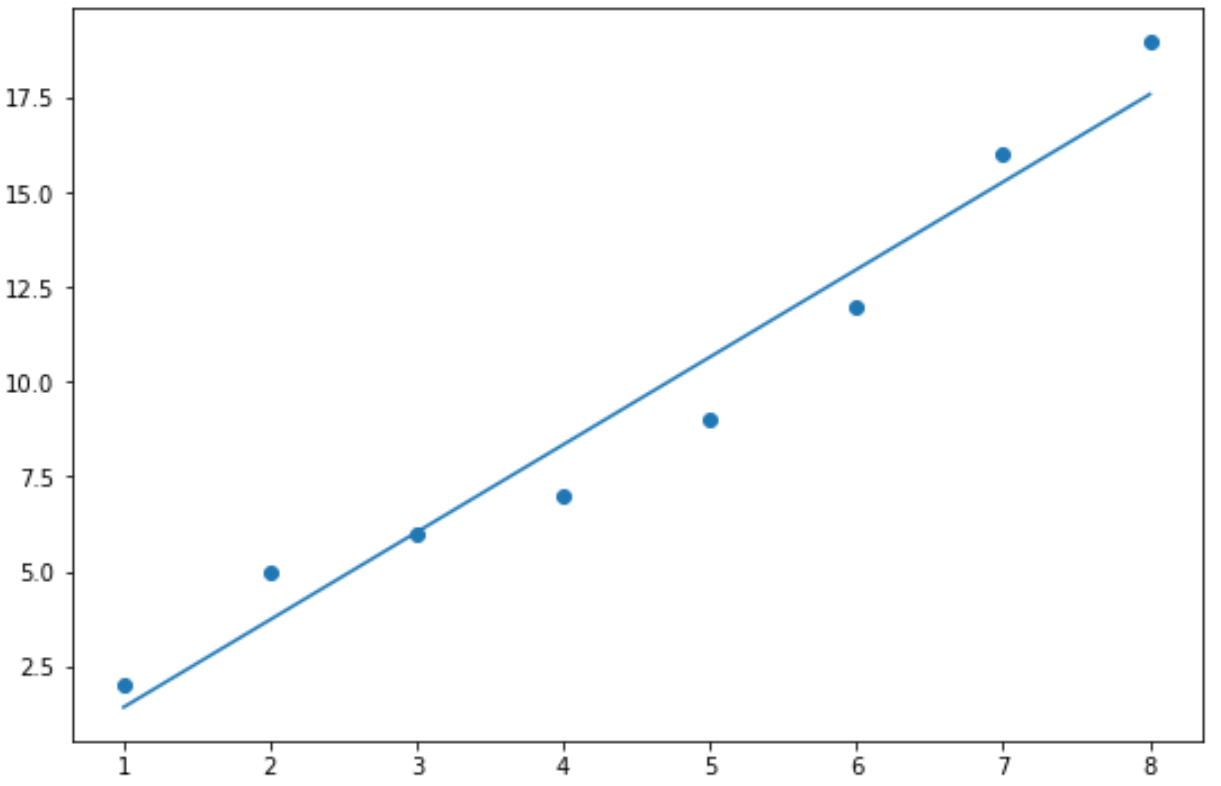
以下代码展示了如何在 Python 中绘制最佳拟合基线:
 import numpy as np
import matplotlib. pyplot as plt

#define data
x = np. array ([1, 2, 3, 4, 5, 6, 7, 8])
y = np. array ([2, 5, 6, 7, 9, 12, 16, 19])

#find line of best fit
a, b = np. polyfit (x, y, 1)

#add points to plot
plt. scatter (x,y)

#add line of best fit to plot
plt. plot (x, a*x+b)

示例 2:在 Python 中绘制最适合的自定义线
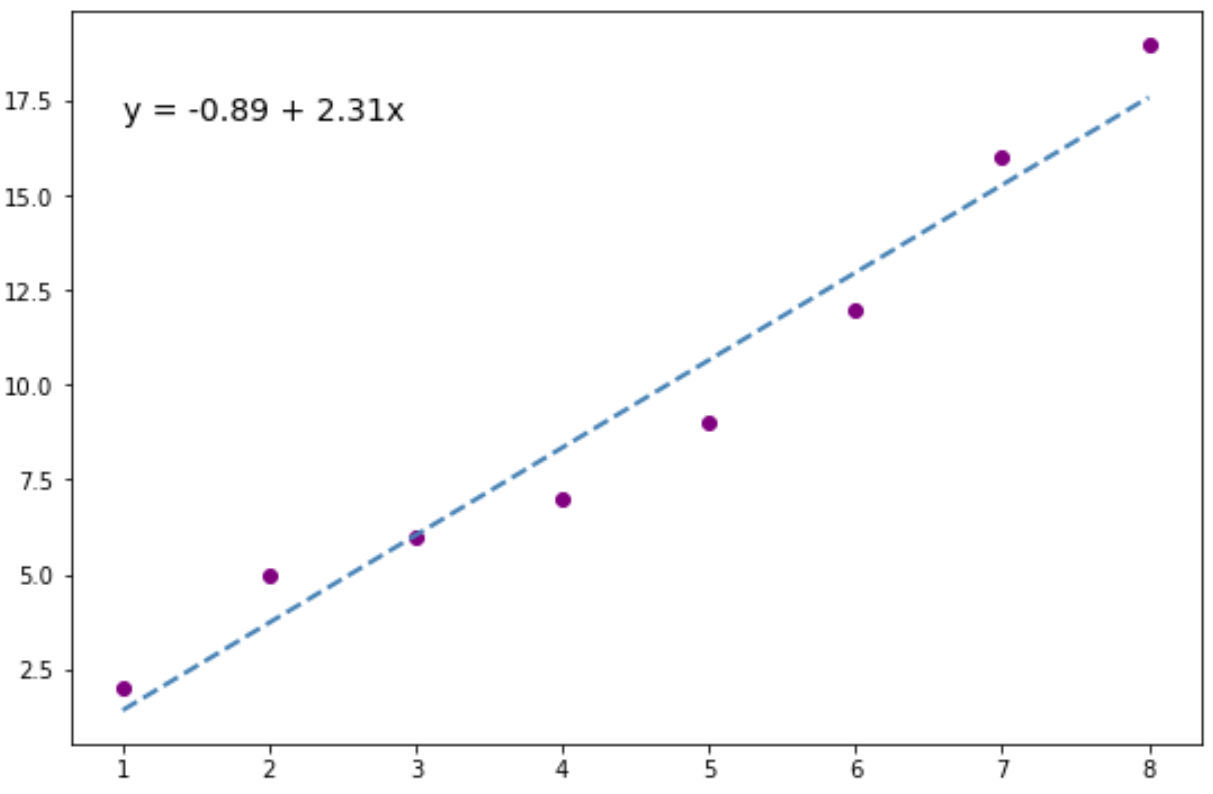
以下代码显示了如何创建与前面的示例相同的最佳拟合线,并添加了以下内容:
- 点和最佳拟合线的自定义颜色
- 定制样式和宽度以获得最佳贴合线条
- 绘图上显示的拟合回归线方程
 import numpy as np
import matplotlib. pyplot as plt

#define data
x = np. array ([1, 2, 3, 4, 5, 6, 7, 8])
y = np. array ([2, 5, 6, 7, 9, 12, 16, 19])

#find line of best fit
a, b = np. polyfit (x, y, 1)

#add points to plot
plt. scatter (x,y,color=' purple ')

#add line of best fit to plot
plt. plot (x, a*x+b, color=' steelblue ', linestyle=' -- ', linewidth= 2 )

#add fitted regression equation to plot
plt. text (1, 17, 'y = ' + '{:.2f}'. format (b) + ' + {:.2f}'. format (a) + 'x', size= 14 )

您可以随意将拟合回归方程放置在绘图上您想要的任何(x,y)坐标中。
对于这个特定的示例,我们选择 (x, y) = (1, 17)。
其他资源
以下教程解释了如何在 Python 中拟合不同的回归模型: