如何在 python 中创建带有回归线的散点图
通常,在执行简单的线性回归时,您可能需要创建散点图来可视化 x 和 y 值的不同组合以及估计的回归线。
幸运的是,有两种简单的方法可以在 Python 中创建此类绘图。本教程使用以下数据解释这两种方法:
 import numpy as np

#createdata
x = np.array([1, 1, 2, 3, 4, 4, 5, 6, 7, 7, 8, 9])
y = np.array([13, 14, 17, 12, 23, 24, 25, 25, 24, 28, 32, 33])
方法一:使用Matplotlib
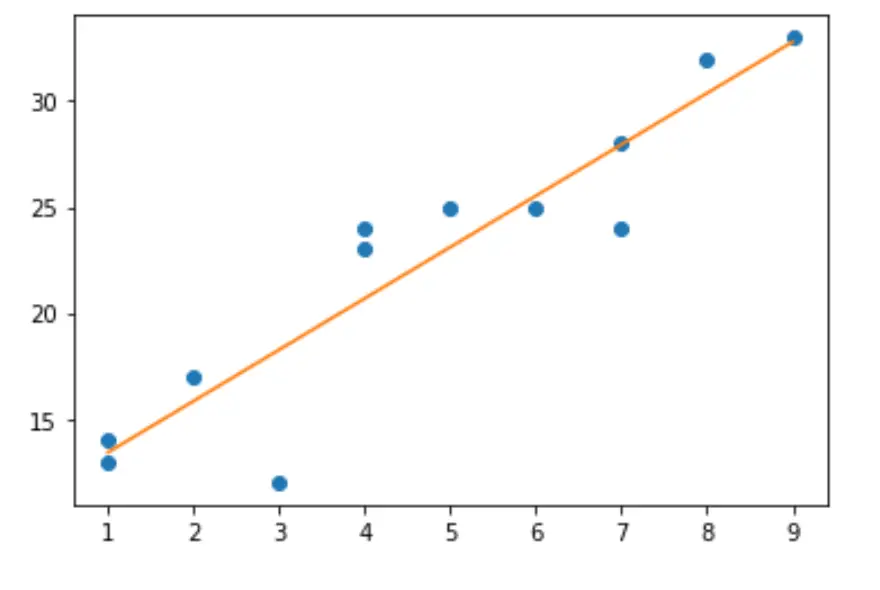
以下代码展示了如何使用 Matplotlib 创建带有该数据的估计回归线的散点图:
 import matplotlib.pyplot as plt

#create basic scatterplot
plt.plot(x, y, 'o')

#obtain m (slope) and b(intercept) of linear regression line
m, b = np.polyfit(x, y, 1)

#add linear regression line to scatterplot
plt.plot(x, m*x+b)

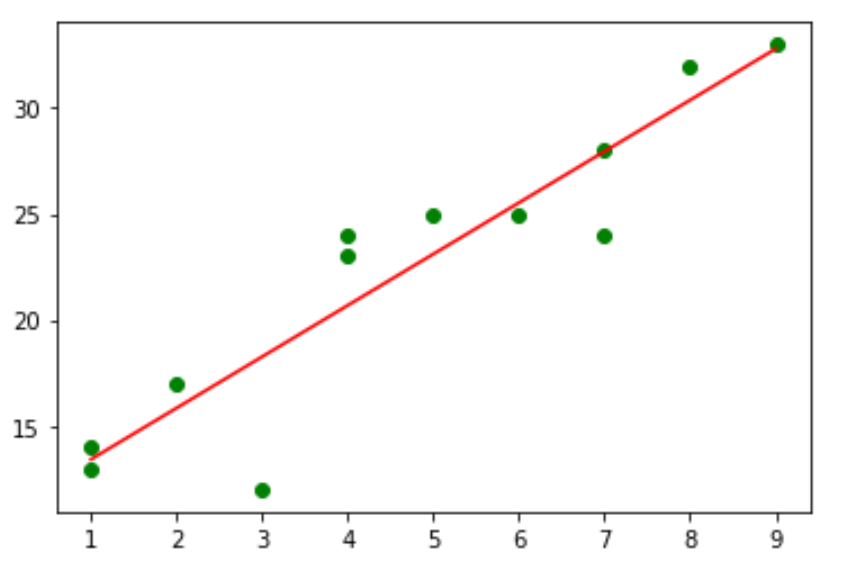
您可以根据需要随意更改图表的颜色。例如,以下是将各个点更改为绿色并将线条更改为红色的方法:
 #use green as color for individual points
plt.plot(x, y, 'o', color=' green ')

#obtain m (slope) and b(intercept) of linear regression line
m, b = np.polyfit(x, y, 1)

#use red as color for regression line
plt.plot(x, m*x+b, color=' red ')

方法2:使用Seaborn
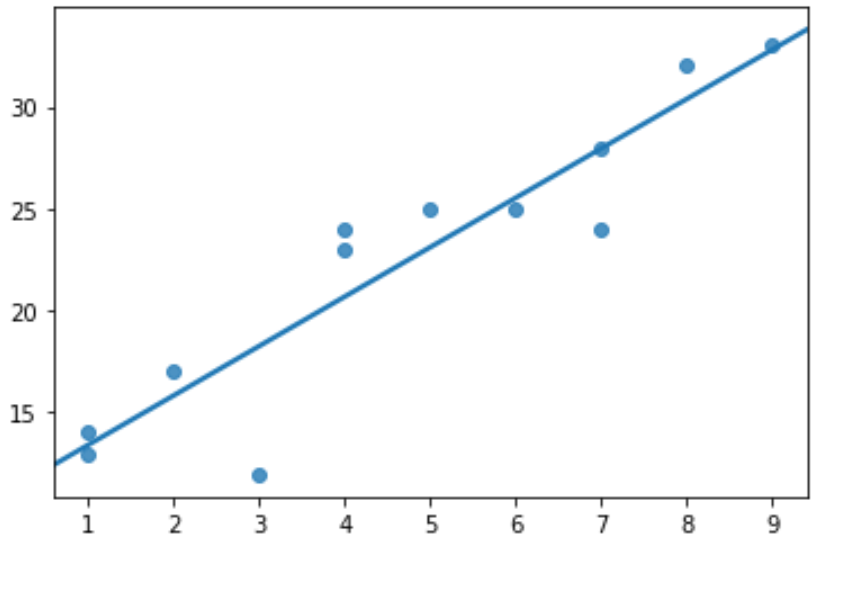
您还可以使用 Seaborn 可视化库的regplot()函数创建带有回归线的散点图:
 import seaborn as sns

#create scatterplot with regression line
sns.regplot(x, y, ci=None)

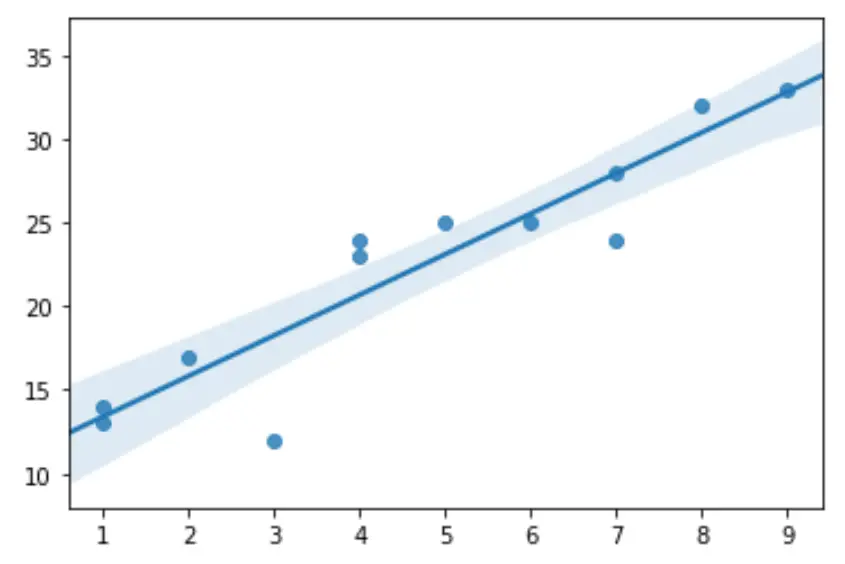
请注意, ci=None告诉 Seaborn 在绘图上隐藏置信区间带。但是,如果您愿意,您可以选择显示它们:
 import seaborn as sns

#create scatterplot with regression line and confidence interval lines
sns.regplot(x,y)

您可以在此处找到regplot()函数的完整文档。