如何绘制 pandas 系列(附示例)
在 pandas 系列中绘制值有两种常见方法:
方法 1:从 Pandas 系列创建线图
 import pandas as pd
import matplotlib. pyplot as plt

plt. plot ( my_series.index , my_series.values )
方法 2:从 Pandas 系列创建直方图
 import pandas as pd
import matplotlib. pyplot as plt

my_series. plot (kind=' hist ')
以下示例展示了如何在实践中使用每种方法。
示例 1:从 pandas 系列创建线图
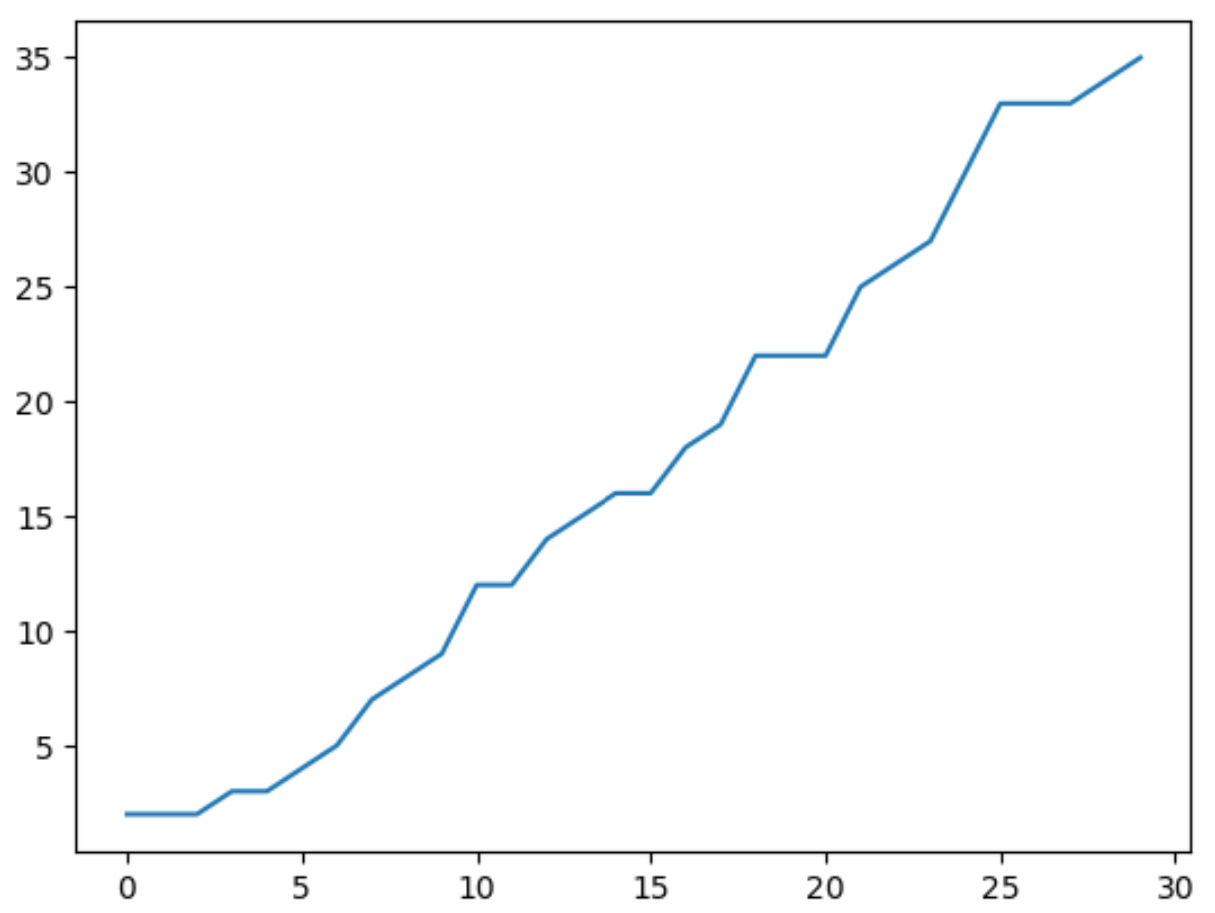
以下代码显示了如何从 pandas 系列创建线图:
 import pandas as pd
import matplotlib. pyplot as plt

#create pandas Series
my_series = pd. Series ([2, 2, 2, 3, 3, 4, 5, 7, 8, 9, 12, 12, 14, 15, 16, 16, 18,
                       19, 22, 22, 22, 25, 26, 27, 30, 33, 33, 33, 34, 35])

#create line plot to visualize values in Series
plt. plot ( my_series.index , my_series.values )

x轴显示pandas系列的索引值,y轴显示该系列的实际值。
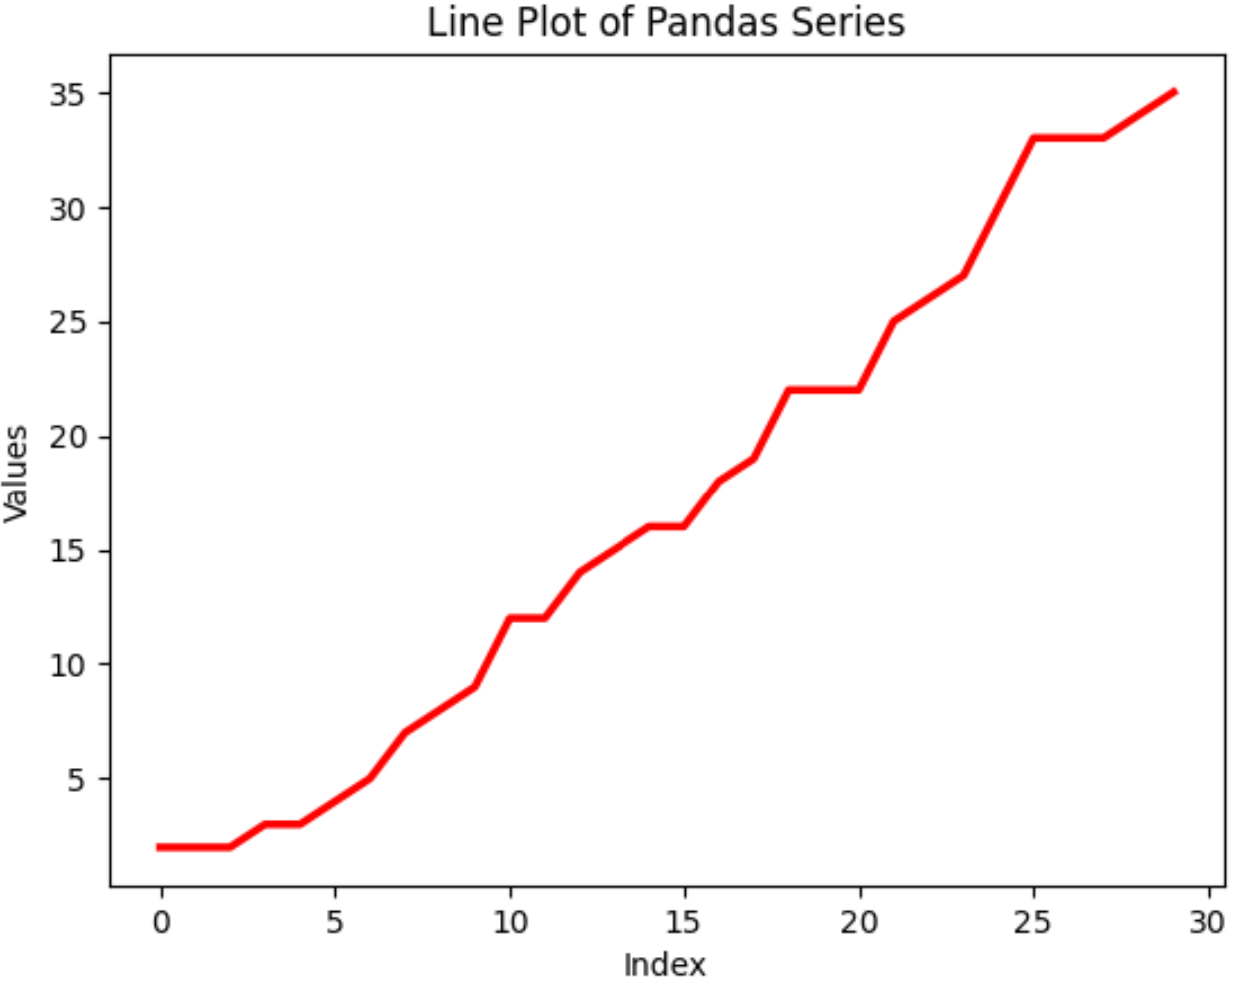
您还可以使用各种 pandas 和 matplotlib 函数来自定义线条的外观以及轴标签和绘图标题:
 #create customized line plot
plt. plot (my_series. index , my_series. values , color=' red ', linewidth= 2.5 )

#add axis labels and title
plt. xlabel (' Index ')
plt. ylabel (' Values ')
plt. title (' Line Plot of Pandas Series ')

示例 2:从一系列 pandas 创建直方图
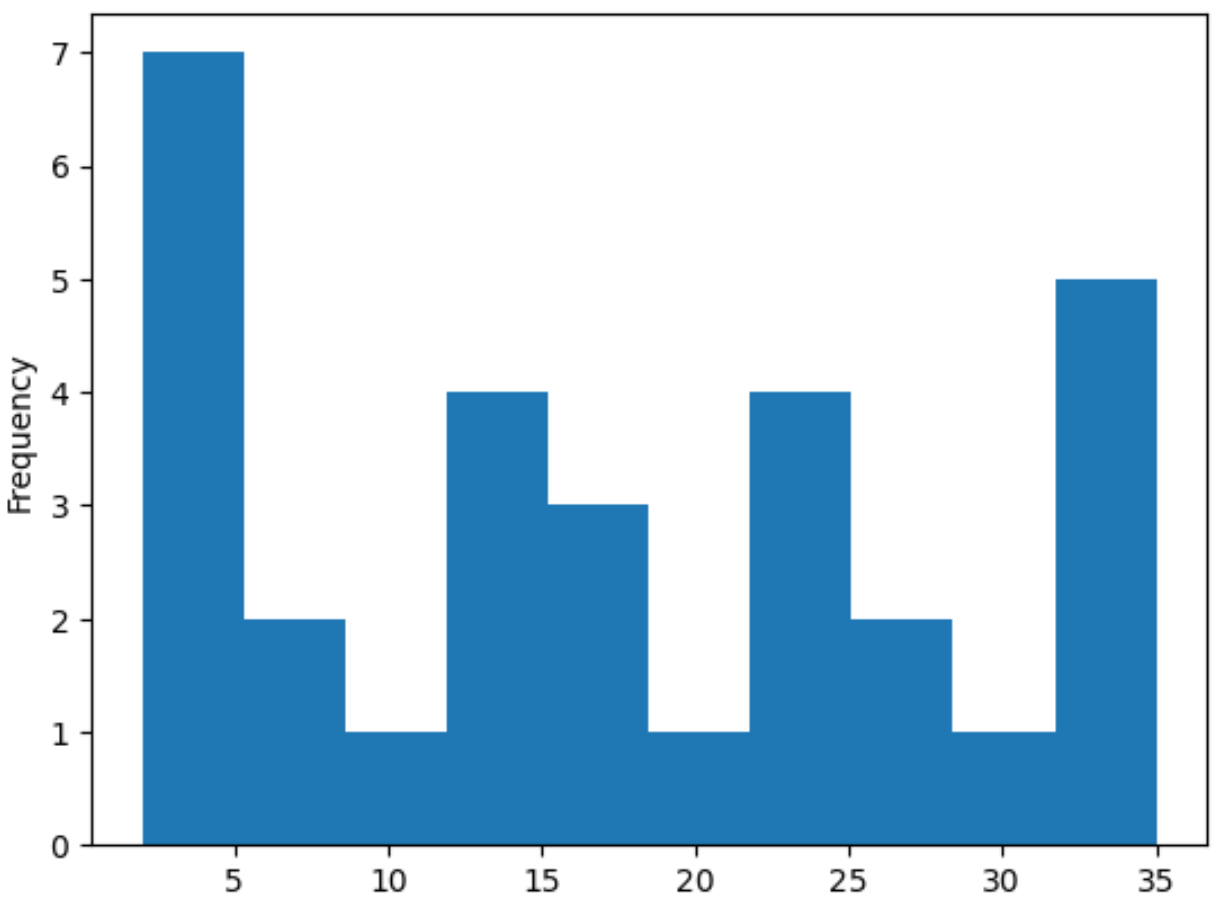
以下代码显示了如何从 pandas 系列创建直方图:
 import pandas as pd
import matplotlib. pyplot as plt

#create pandas Series
my_series = pd. Series ([2, 2, 2, 3, 3, 4, 5, 7, 8, 9, 12, 12, 14, 15, 16, 16, 18,
                       19, 22, 22, 22, 25, 26, 27, 30, 33, 33, 33, 34, 35])

#create histogram visualize distribution of values in Series
my_series. plot (kind=' hist ')

x 轴显示 pandas 系列的值,y 轴显示值的频率。
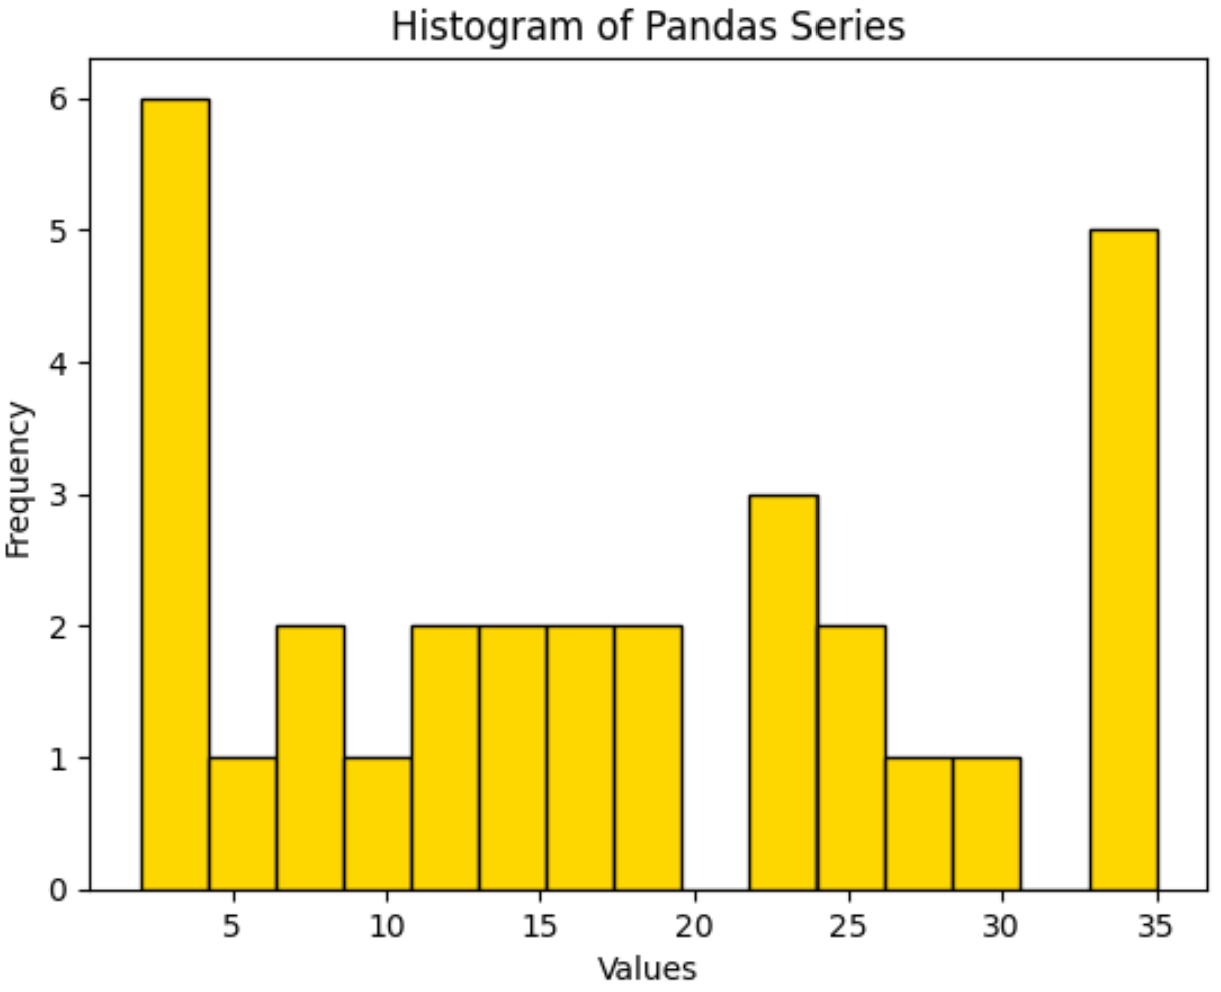
您还可以使用各种 pandas 和 matplotlib 函数来自定义直方图的外观以及直方图中使用的 bin 数量:
 #create histogram with 15 bins
my_series. plot (kind=' hist ', edgecolor=' black ', color=' gold ', bins= 15 )

#add axis labels and title
plt. xlabel (' Values ')
plt. title (' Histogram of Pandas Series ')

请注意,直方图中使用的默认组数是10 。
请随意使用bins参数来增加此数字以生成更多的 bin,或减少此数字以生成更少的 bin。
其他资源
以下教程解释了如何在 pandas 中执行其他常见任务:
如何按值过滤 Pandas 系列
如何将 Pandas 系列转换为 DataFrame
如何将 Pandas 系列转换为 NumPy 数组