如何从 pandas dataframe 创建点云
使用 pandas DataFrame 中的数据创建点云有两种方法:
1.使用pandas.DataFrame.plot.scatter
创建散点图的一种方法是使用 pandas 内置的plot.scatter()函数:
 import pandas as pd

df. plot . scatter (x = ' x_column_name ', y = ' y_columnn_name ')
2.使用matplotlib.pyplot.scatter
创建散点图的另一种方法是使用 Matplotlib pyplot.scatter()函数:
 import matplotlib. pyplot as plt

plt. scatter (df.x, df.y)
本教程提供了使用每种方法的示例。
示例 1:使用 pandas
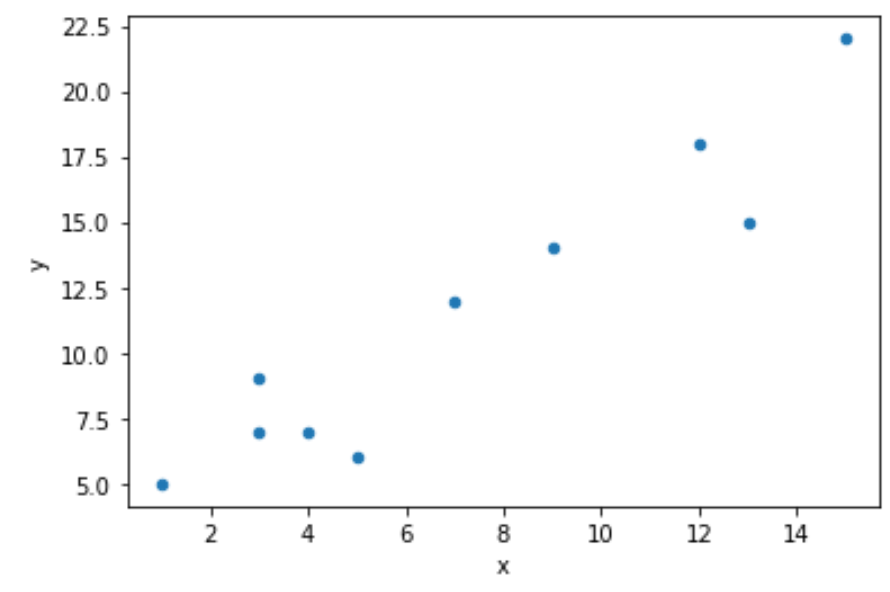
以下代码展示了如何使用plot.scatter()函数创建简单的散点图:
 import pandas as pd

#createDataFrame
df = pd. DataFrame ({'x': [1, 3, 3, 4, 5, 7, 9, 12, 13, 15],
                   'y': [5, 7, 9, 7, 6, 12, 14, 18, 15, 22]})

#create scatterplot
df. plot . scatter (x=' x ', y=' y ')

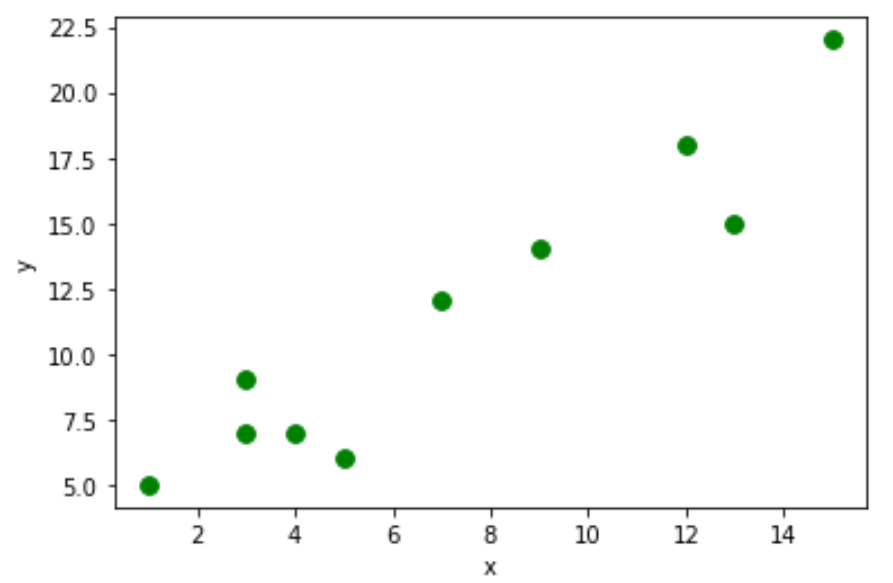
请注意,您可以使用s和c参数分别更改点的大小和颜色:
df. plot . scatter (x=' x ', y=' y ', s= 60 , c=' green ')

示例 2:使用 Matplotlib
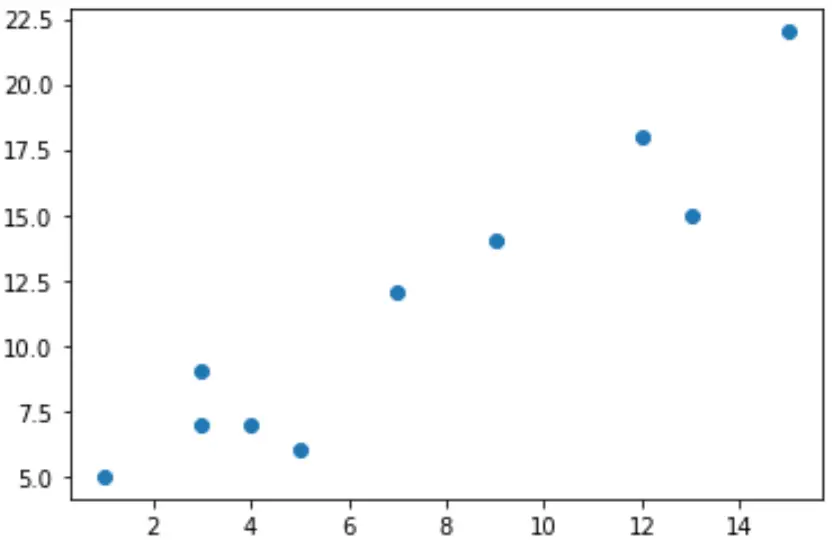
以下代码显示如何使用pyplot.scatter()函数创建散点图:
 import pandas as pd
import matplotlib. pyplot as plt

#createDataFrame
df = pd. DataFrame ({'x': [1, 3, 3, 4, 5, 7, 9, 12, 13, 15],
                   'y': [5, 7, 9, 7, 6, 12, 14, 18, 15, 22]})

#create scatterplot
plt. scatter (df.x, df.y)

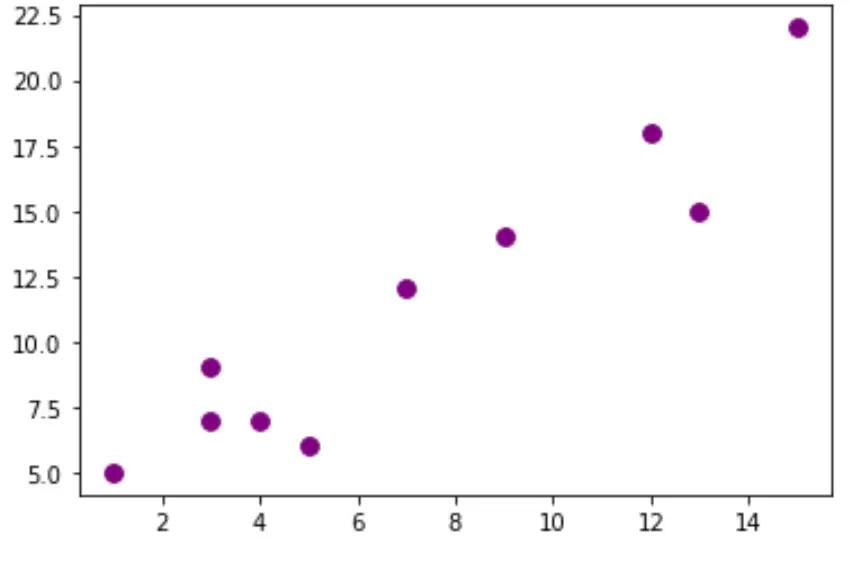
请注意,您可以使用s和c参数分别更改点的大小和颜色:
plt. scatter (df.x, df.y, s= 60 , c=' purple ')

您可以在此处找到更多 Python 教程。