如何更改直方图 pandas 的图形大小
您可以使用Figsize参数来更改在pandas中创建的直方图的图形大小:
 import matplotlib. pyplot as plt

#specify figure size (width, height)
fig = plt. figure (figsize=(8,3))
ax = fig. gca ()

#create histogram using specified figure size
df[' my_column ']. hist (ax=ax)
以下示例展示了如何在实践中使用Figsize参数。
示例:如何更改熊猫直方图图形的大小
假设我们有以下 pandas DataFrame:
 import pandas as pd

#createDataFrame
df = pd. DataFrame ({' player ': ['A', 'B', 'C', 'D', 'E', 'F', 'G', 'H',
                              'I', 'J', 'K', 'L', 'M', 'N', 'O', 'P'],
                   ' points ': [10, 12, 14, 15, 15, 15, 16, 17,
                              19, 19, 24, 24, 28, 30, 34, 34]})

#view first five rows of DataFrame
print ( df.head ())

  player points
0 to 10
1 B 12
2 C 14
3 D 15
4 E 15
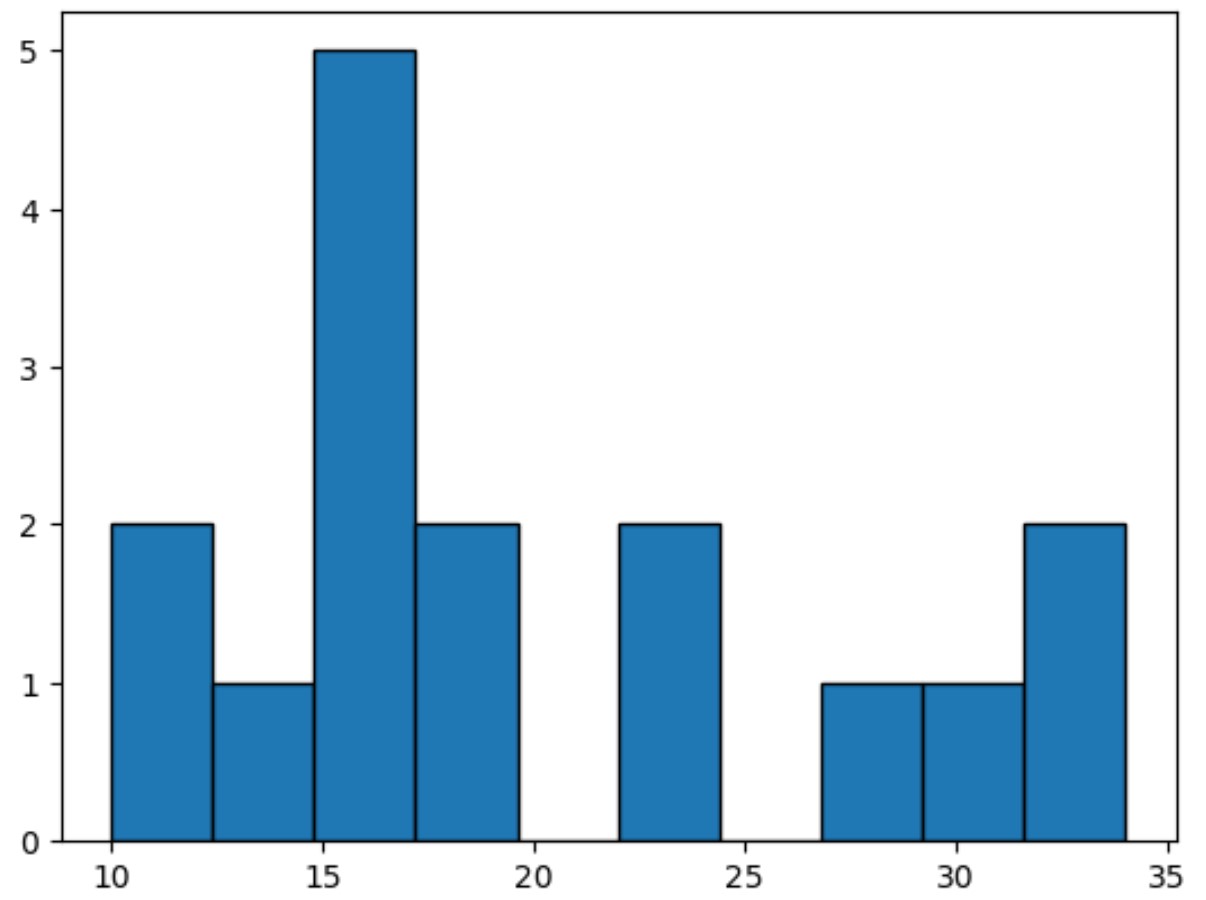
如果我们为points变量创建一个直方图,pandas将自动使用6.4作为图形的宽度, 4.8作为高度:
 import matplotlib. pyplot as plt

#create histogram for variable points
df[' points ']. hist (grid= False ,edgecolor=' black ')

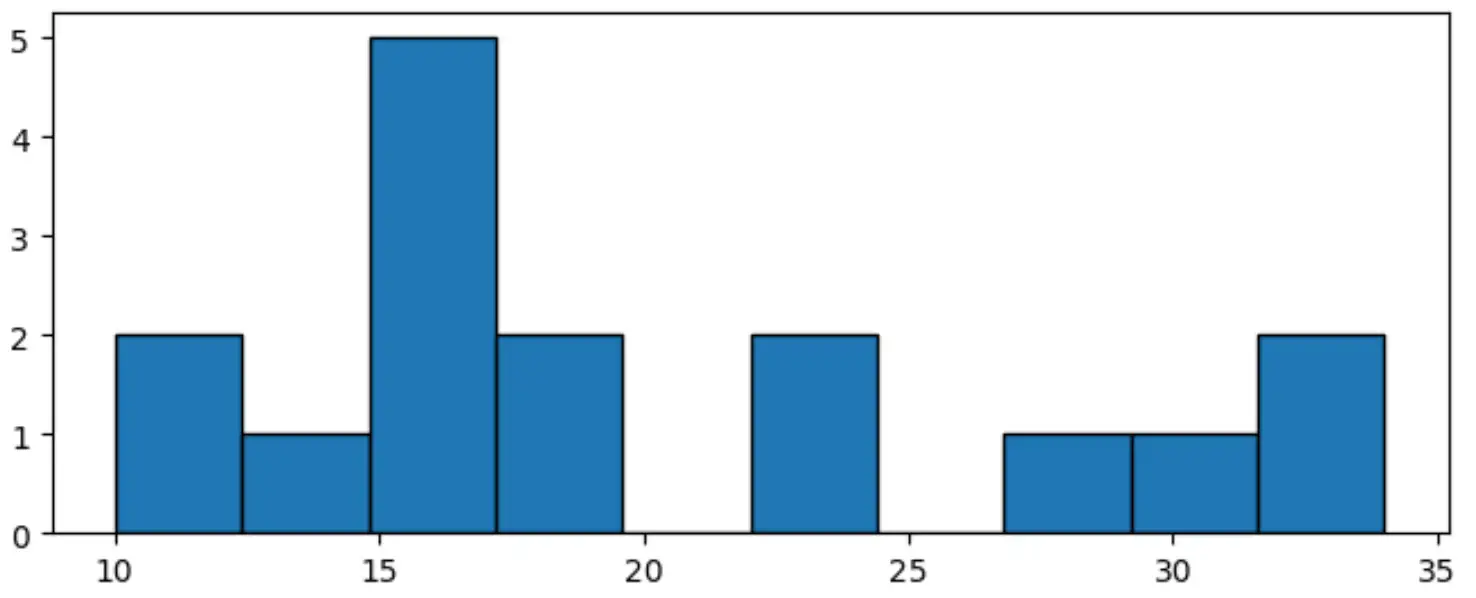
但是,我们可以使用Figsize参数来更改图形的宽度和高度:
 import matplotlib. pyplot as plt

#specify figure size (width, height)
fig = plt. figure (figsize=(8,3))
ax = fig. gca ()

#create histogram using specified figure size
df[' points ']. hist ( grid= False , edgecolor=' black ', ax=ax)

这个特定的直方图的宽度为8 ,高度为3 。
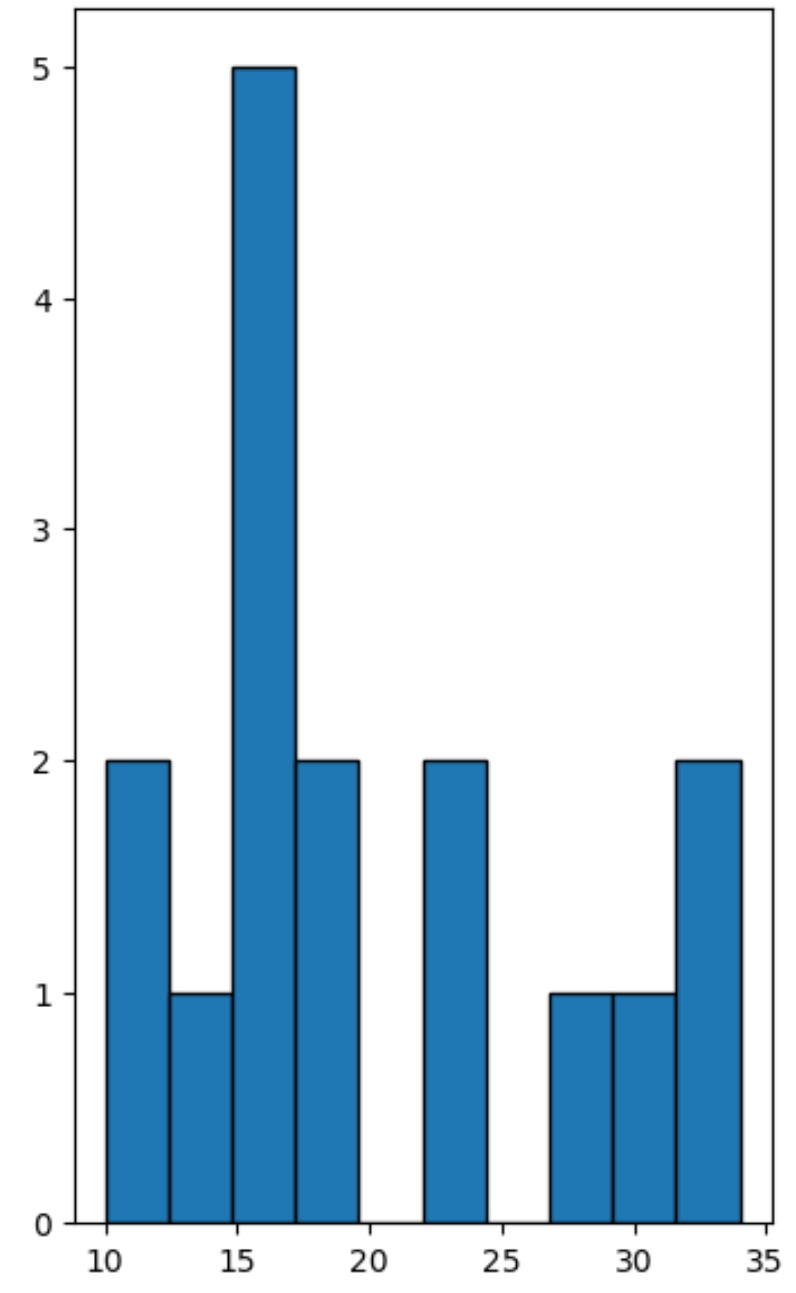
我们还可以使用Figsize参数来创建一个高度大于宽度的图形:
 import matplotlib. pyplot as plt

#specify figure size (width, height)
fig = plt. figure (figsize=(4,7))
ax = fig. gca ()

#create histogram using specified figure size
df[' points ']. hist ( grid= False , edgecolor=' black ', ax=ax)

这个特定的直方图的宽度为4 ,高度为7 。
您可以随意使用Figsize参数的值来创建具有您想要的确切大小的直方图。
其他资源
以下教程解释了如何在 pandas 中执行其他常见任务:
如何从 Pandas DataFrame 创建直方图
如何从 Pandas 系列创建直方图
如何在 Pandas 中按组绘制直方图