如何在 r 中绘制威布尔分布
要绘制 R 中威布尔分布的概率密度函数,我们可以使用以下函数:
- dweibull(x, shape, scale = 1)创建概率密度函数。
- curve(function, from = NULL, to = NULL)绘制概率密度函数。
为了绘制概率密度函数,我们需要指定dweibull函数中的形状和尺度参数的值以及curve()函数中的from和to值。
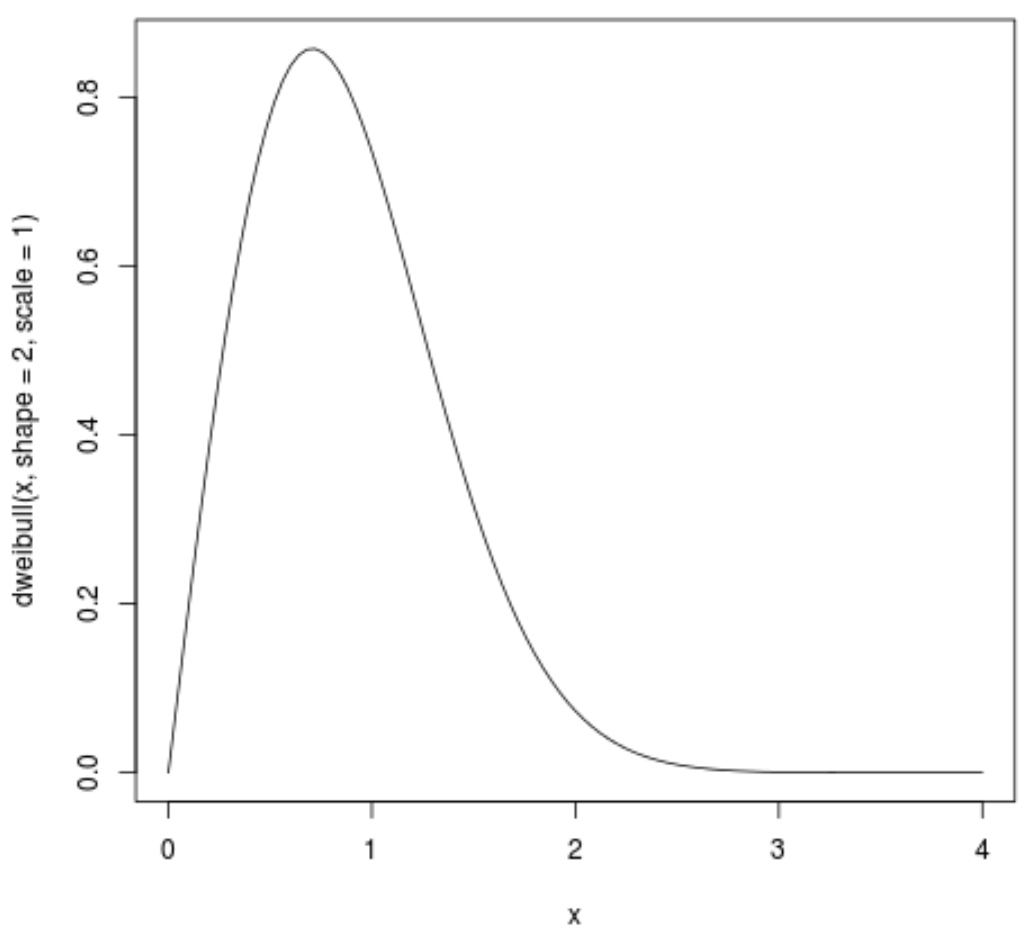
例如,以下代码说明了如何绘制参数 shape = 2 和 scale = 1 的威布尔分布的概率密度函数,其中绘图的 x 轴从 0 到 4:
curve(dweibull(x, shape=2, scale = 1), from=0, to=4)

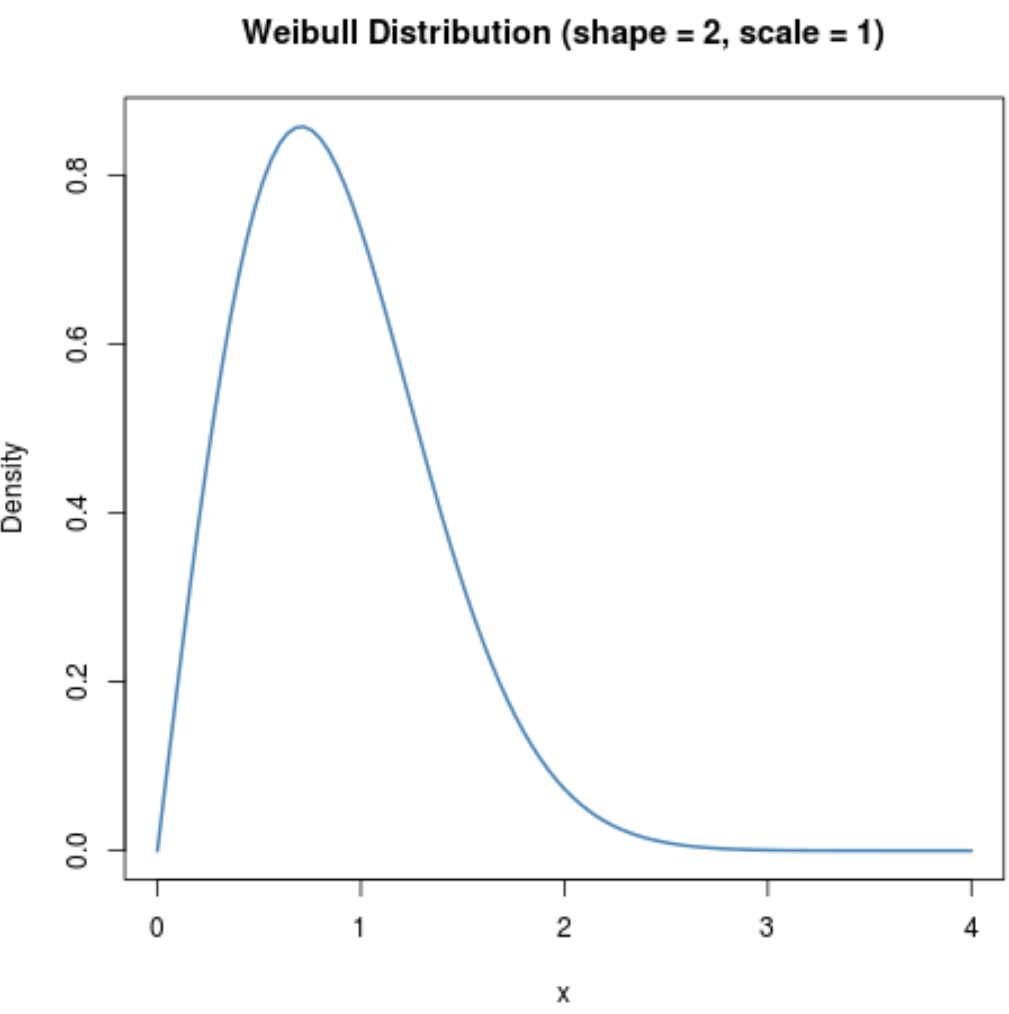
我们可以添加标题、更改 Y 轴标签、增加行宽,甚至更改行颜色,以使绘图更加美观:
 curve(dweibull(x, shape=2, scale = 1), from=0, to=4,
    main = 'Weibull Distribution (shape = 2, scale = 1)', #add title
    ylab = 'Density', #change y-axis label
    lwd = 2, #increase line width to 2
    col = 'steelblue') #change line color to steelblue

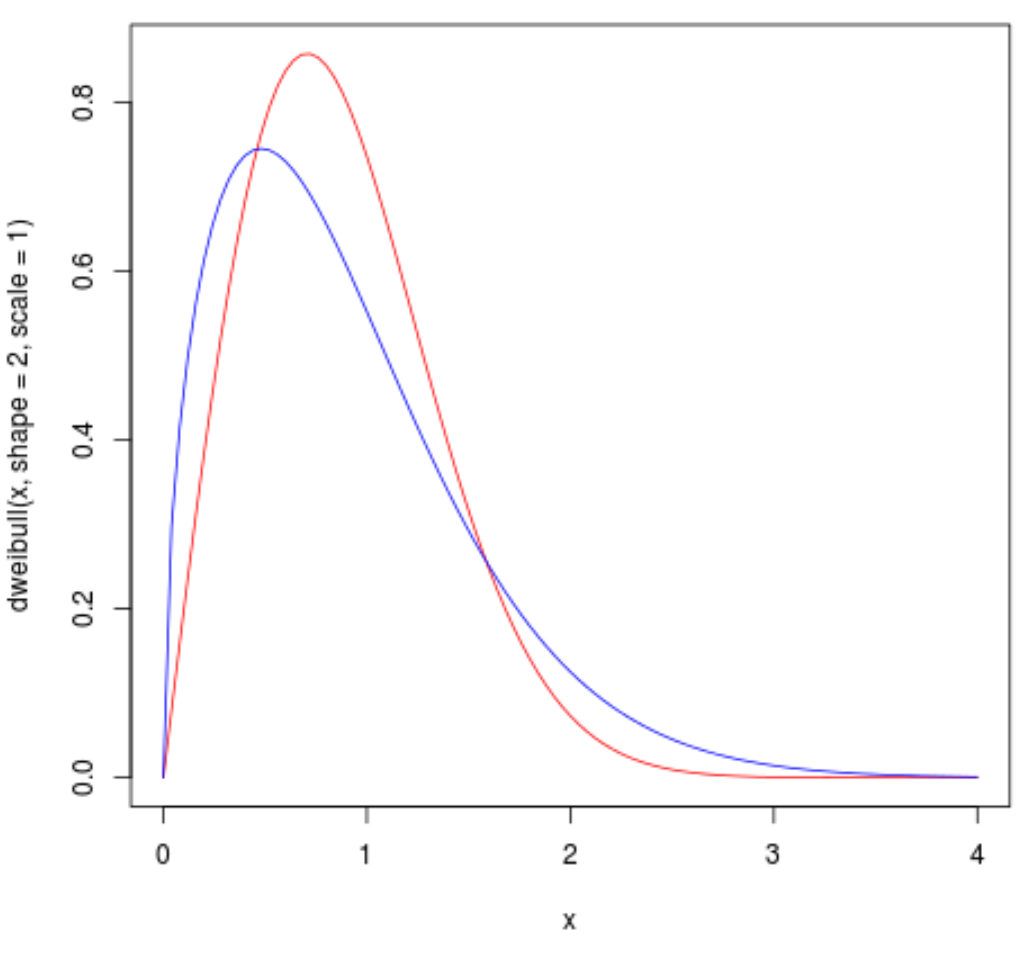
我们还可以在图中添加几条曲线来比较具有不同形状和尺度参数的威布尔分布:
 curve(dweibull(x, shape=2, scale = 1), from=0, to=4, col='red')
curve(dweibull(x, shape=1.5, scale = 1), from=0, to=4, col='blue', add=TRUE)

我们可以使用legend()函数向图中添加图例,该函数采用以下语法:
图例(x,y = NULL,图例,填充,col,bg,lty,cex)
金子:
- x, y:用于定位图例的 x 和 y 坐标
- 图例:要放入图例中的文本
- fill:图例内的填充颜色
- col:用于图例内线条的颜色列表
- bg:图例的背景颜色
- lty:线条样式
- cex:图例中文本的大小
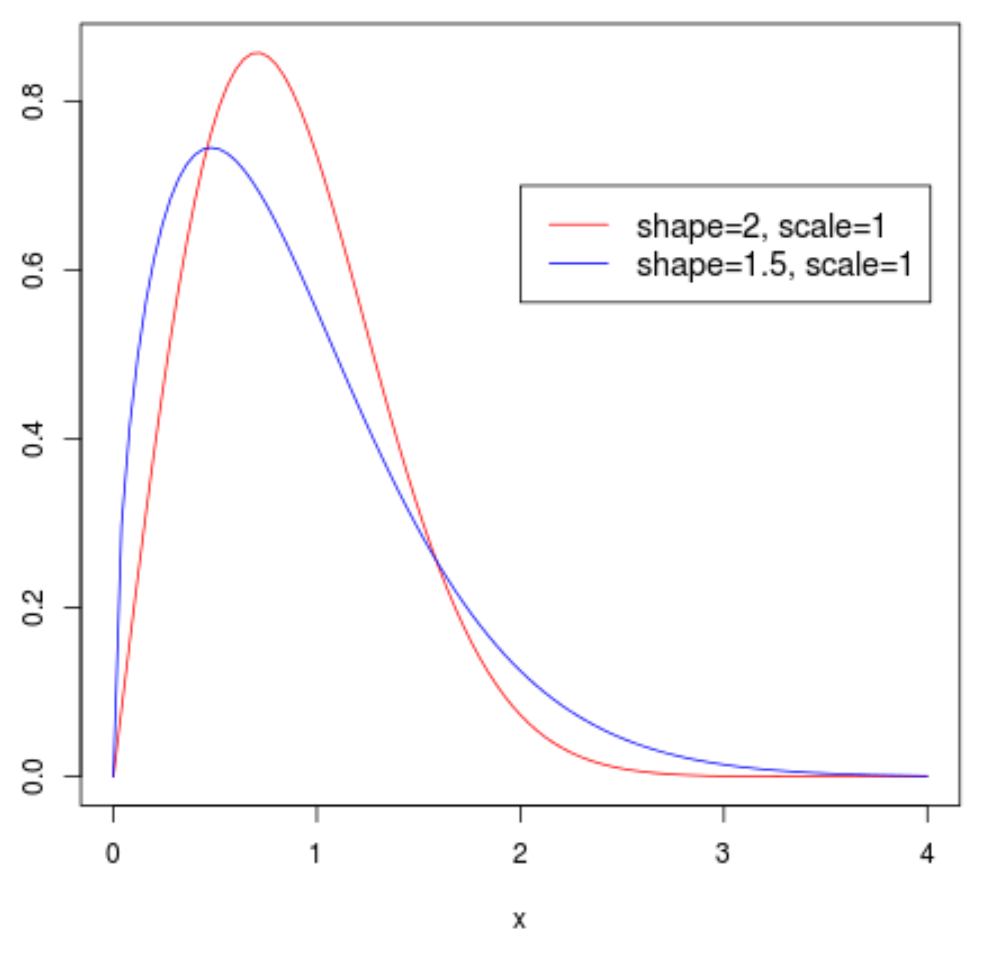
在我们的示例中,我们将使用以下语法来创建图例:
 #create density plots
curve(dweibull(x, shape=2, scale = 1), from=0, to=4, col='red')
curve(dweibull(x, shape=1.5, scale = 1), from=0, to=4, col='blue', add=TRUE)

#add legend
legend(2, .7, legend=c("shape=2, scale=1", "shape=1.5, scale=1"),
       col=c("red", "blue"), lty=1, cex=1.2)
