如何用 python 计算自相关
自相关衡量连续时间间隔内时间序列与其自身滞后版本之间的相似程度。
有时也称为“序列相关”或“滞后相关”,因为它衡量变量的当前值与其历史值之间的关系。
当时间序列中的自相关性较高时,只需参考过去的值即可轻松预测未来值。
如何用 Python 计算自相关
假设我们在 Python 中有以下时间序列,显示 15 个不同时期内某个变量的值:
 #define data
x = [22, 24, 25, 25, 28, 29, 34, 37, 40, 44, 51, 48, 47, 50, 51]
我们可以使用 statsmodels 库中的acf() 函数计算时间序列中每个滞后的自相关:
 import statsmodels.api as sm

#calculate autocorrelations
sm.tsa.acf(x)

array([ 1. , 0.83174224, 0.65632458, 0.49105012, 0.27863962,
        0.03102625, -0.16527446, -0.30369928, -0.40095465, -0.45823389,
       -0.45047733])
结果解释方式如下:
- 滞后 0 处的自相关为1 。
- 滞后 1 处的自相关为0.8317 。
- 滞后 2 处的自相关为0.6563 。
- 滞后 3 处的自相关为0.4910 。
等等。
我们还可以通过nlags参数指定要使用的滞后数:
 sm.tsa.acf(x, nlags= 5 )

array([1.0, 0.83174224, 0.65632458, 0.49105012, 0.27863962, 0.03102625])
如何在Python中绘制自相关函数
我们可以使用 statsmodels 库中的tsaplots.plot_acf() 函数在 Python 中绘制时间序列的自相关函数:
 from statsmodels.graphics import tsaplots
import matplotlib.pyplot as plt

#plot autocorrelation function
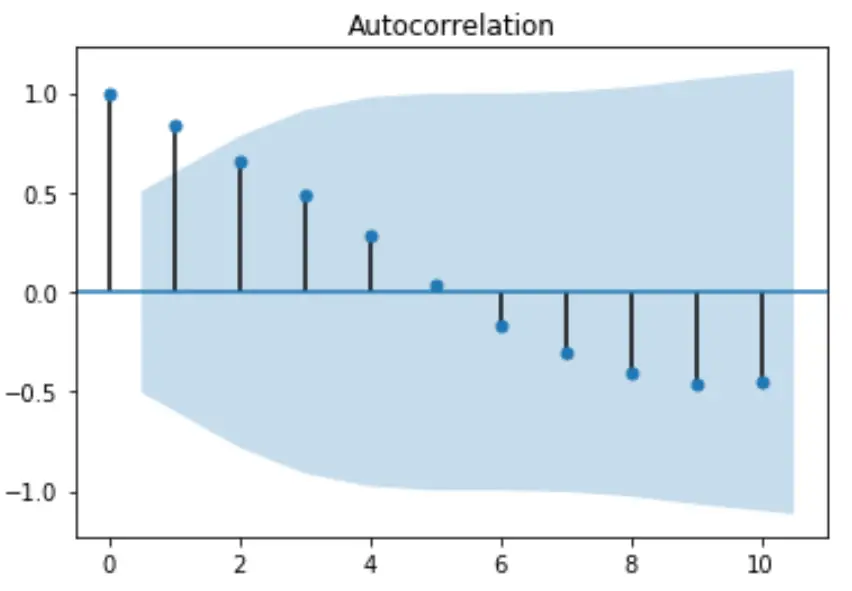
fig = tsaplots.plot_acf(x, lags=10)
plt.show()

x 轴显示滞后数,y 轴显示该滞后数处的自相关。默认情况下,绘图从 lag = 0 开始,并且在 lag = 0 时自相关始终为1 。
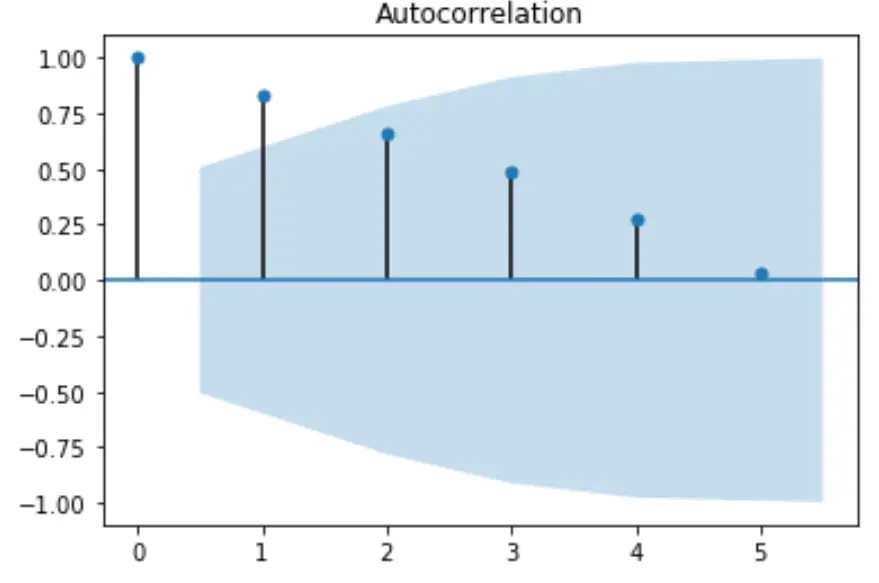
我们还可以通过选择使用较少的滞后与lags参数来放大第一个滞后:
 from statsmodels.graphics import tsaplots
import matplotlib.pyplot as plt

#plot autocorrelation function
fig = tsaplots.plot_acf(x, lags= 5 )
plt.show()

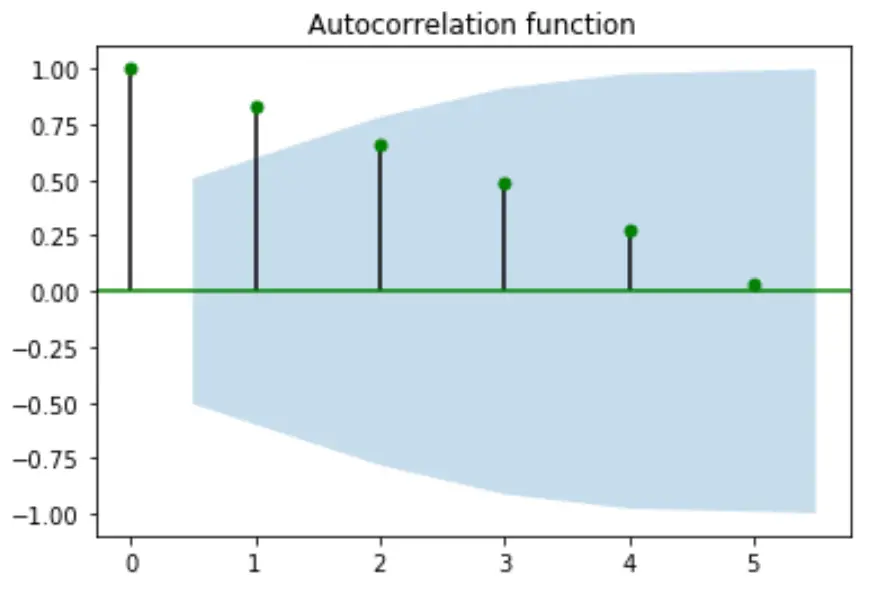
您还可以使用标题和颜色参数更改图中使用的圆圈的标题和颜色:
 from statsmodels.graphics import tsaplots
import matplotlib.pyplot as plt

#plot autocorrelation function
fig = tsaplots.plot_acf(x, lags= 5, color='g', title='Autocorrelation function' )
plt.show()

您可以在此页面上找到更多 Python 教程。