如何在 r 中使用 par() 函数
您可以使用 R 中的par()函数一次创建多个绘图。
该函数使用以下基本语法:
 #define plot area as four rows and two columns
by(mfrow = c(4, 2))

#create plots
plot(1:5)
plot(1:20)
...
以下示例展示了如何在实践中使用此功能。
示例 1:使用 par() 显示多个图
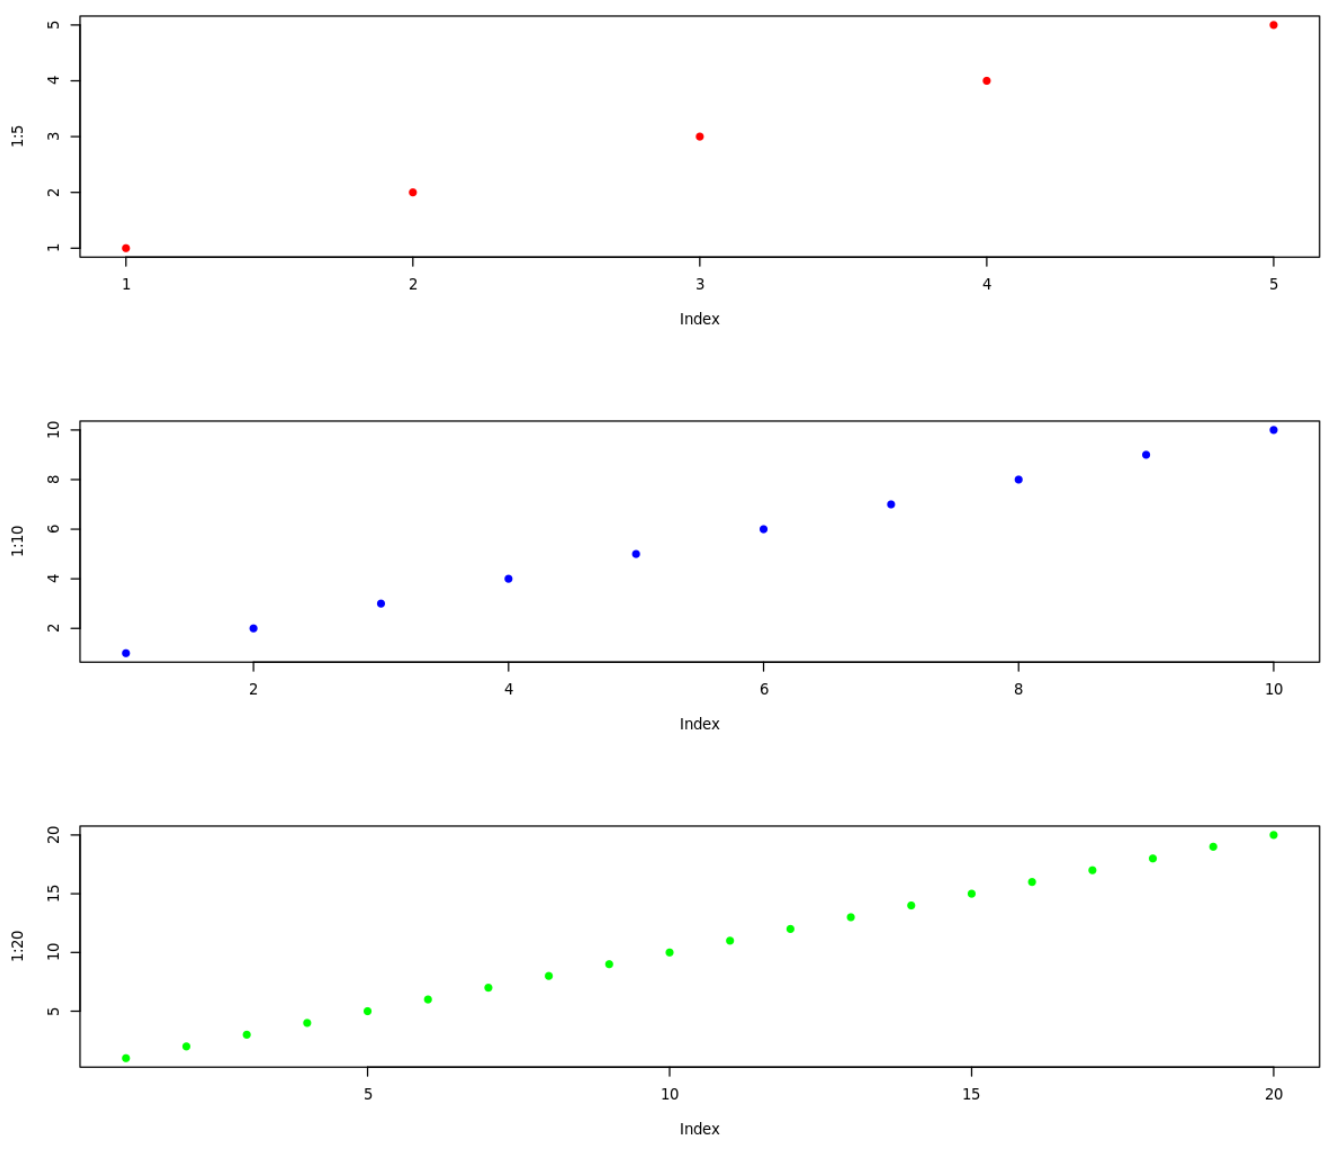
以下代码显示如何使用par()函数定义 3 行 1 列的绘图区域:
 #define plot area as three rows and one column
by(mfrow = c(3, 1))

#create plots
plot(1:5, pch=19, col=' red ')
plot(1:10, pch=19, col=' blue ')
plot(1:20, pch=19, col=' green ')
示例 2:使用 mar() 指定路径边距
以下代码演示如何使用mar()参数按以下顺序指定每个路径周围的边距:下、左、上、右。
注意:默认为 mar = c(5.1, 4.1, 4.1, 2.1)
 #define plot area with tiny bottom margin and huge right margin
par(mfrow = c(3, 1), mar = c(0.5, 4, 4, 20))

#create plots
plot(1:5, pch=19, col=' red ')
plot(1:10, pch=19, col=' blue ')
plot(1:20, pch=19, col=' green ')
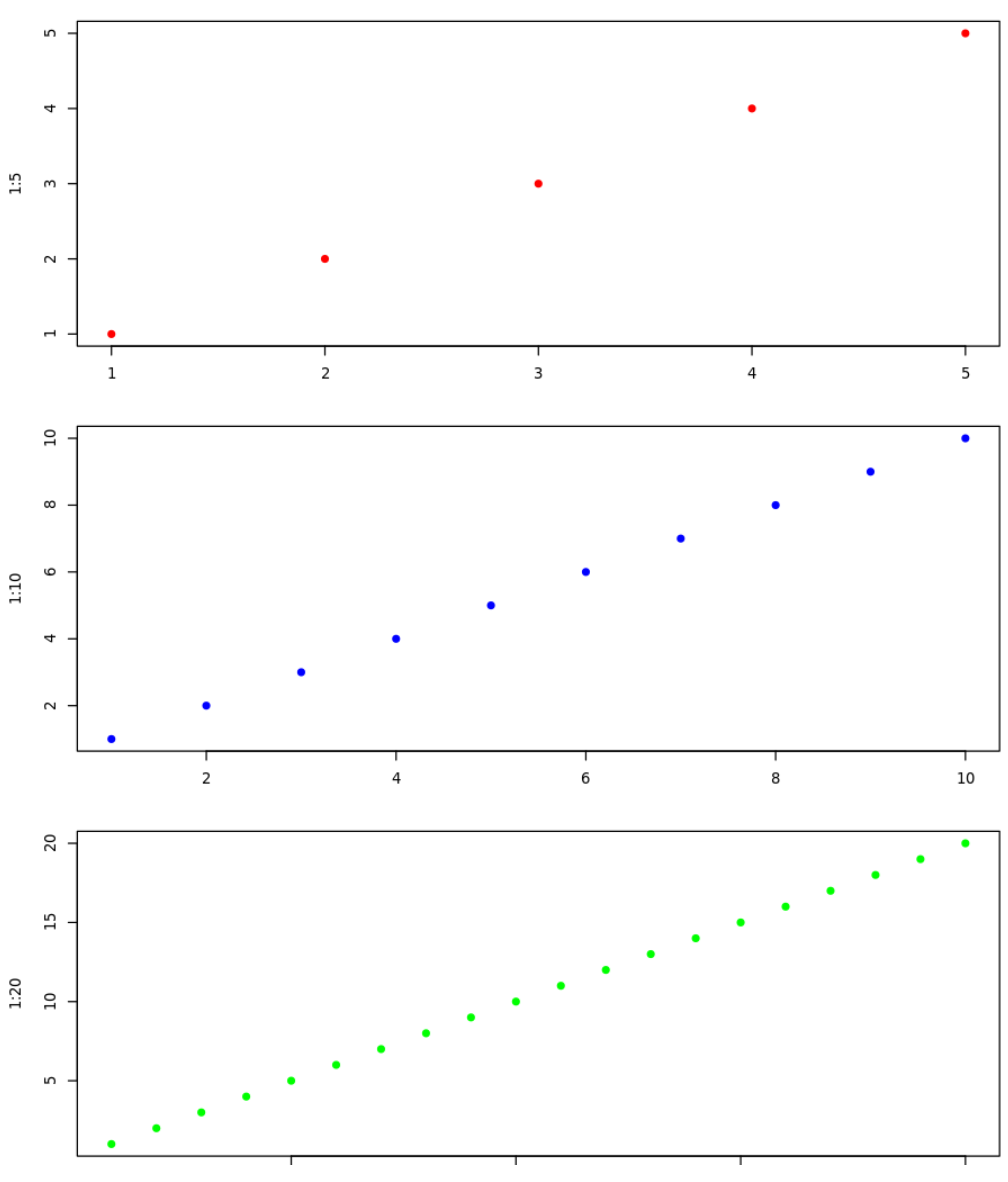
请注意,由于我们将右边距设置得很大,因此路径显得更窄。
示例 3:使用 cex() 指定绘图的文本大小
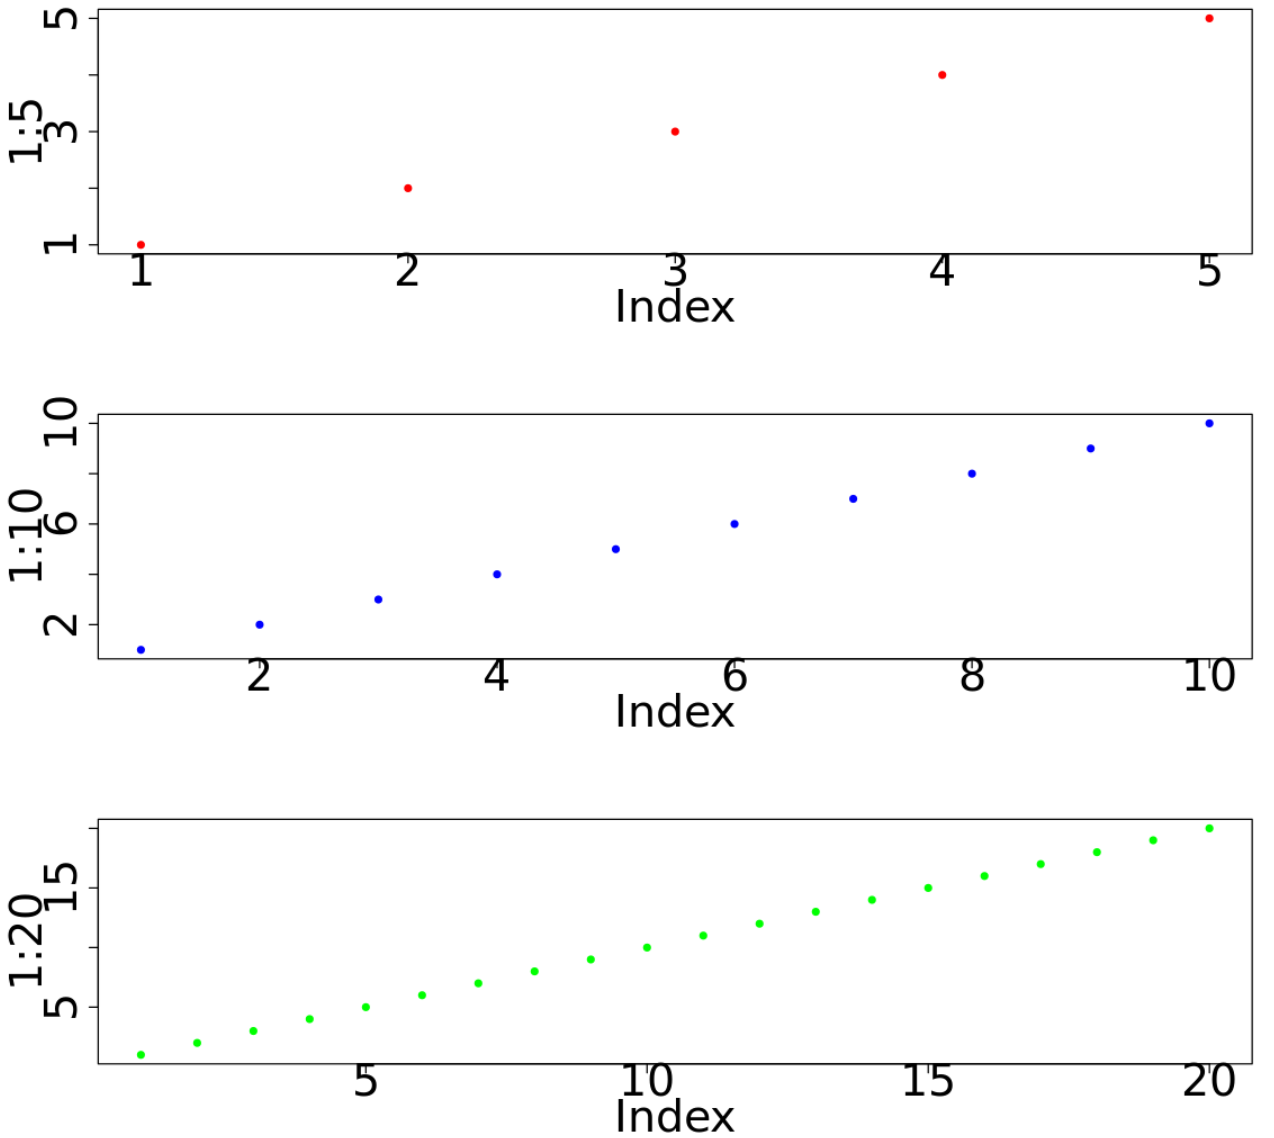
以下代码演示如何使用cex.lab()和cex.axis()参数分别指定轴标签和刻度标签的大小。
注意:默认为 cex.lab = 1 且 cex.axis = 1
 #define plot area with large axis labels
par(mfrow = c(3, 1), mar = c(5, 10, 4, 1), cex. axis = 3, cex. lab = 3)

#create plots
plot(1:5, pch=19, col=' red ')
plot(1:10, pch=19, col=' blue ')
plot(1:20, pch=19, col=' green ')
使用完 par() 函数后,可以使用dev.off()函数重置 par 选项。
 #reset by() options
dev. off ()
每次使用完 par() 函数后,最好使用dev.off() 。
其他资源
关于作者
本杰明·安德森博
大家好,我是本杰明,一位退休的统计学教授,后来成为 Statorials 的热心教师。 凭借在统计领域的丰富经验和专业知识,我渴望分享我的知识,通过 Statorials 增强学生的能力。了解更多