如何计算 pandas 的移动平均线
移动平均线只是时间序列中多个先前周期的平均值。
要计算 pandas DataFrame 中一列或多列的滚动平均值,我们可以使用以下语法:
df[' column_name ']. rolling ( rolling_window ). mean ()
本教程提供了该功能实际使用的几个示例。
示例:计算 pandas 的移动平均值
假设我们有以下 pandas DataFrame:
 import numpy as np
import pandas as pd

#make this example reproducible
n.p. random . seeds (0)

#create dataset
period = np. arange (1, 101, 1)
leads = np. random . uniform (1, 20, 100)
sales = 60 + 2*period + np. random . normal (loc=0, scale=.5*period, size=100)
df = pd. DataFrame ({' period ': period, ' leads ': leads, ' sales ': sales})

#view first 10 rows
df. head (10)

   period leads sales
0 1 11.427457 61.417425
1 2 14.588598 64.900826
2 3 12.452504 66.698494
3 4 11.352780 64.927513
4 5 9.049441 73.720630
5 6 13.271988 77.687668
6 7 9.314157 78.125728
7 8 17.943687 75.280301
8 9 19.309592 73.181613
9 10 8.285389 85.272259
我们可以使用以下语法创建一个新列,其中包含前 5 个周期的“销售额”的移动平均值:
 #find rolling mean of previous 5 sales periods
df[' rolling_sales_5 '] = df[' sales ']. rolling (5). mean ()

#view first 10 rows
df. head (10)

	period leads sales rolling_sales_5
0 1 11.427457 61.417425 NaN
1 2 14.588598 64.900826 NaN
2 3 12.452504 66.698494 NaN
3 4 11.352780 64.927513 NaN
4 5 9.049441 73.720630 66.332978
5 6 13.271988 77.687668 69.587026
6 7 9.314157 78.125728 72.232007
7 8 17.943687 75.280301 73.948368
8 9 19.309592 73.181613 75.599188
9 10 8.285389 85.272259 77.909514
我们可以手动验证第 5 个周期显示的滚动销售平均值是前 5 个周期的平均值:
第 5 期移动平均线:(61.417+64.900+66.698+64.927+73.720)/5 = 66.33
我们可以使用类似的语法来计算多列的移动平均值:
 #find rolling mean of previous 5 leads periods
df[' rolling_leads_5 '] = df[' leads ']. rolling (5). mean ()

#find rolling mean of previous 5 leads periods
df[' rolling_sales_5 '] = df[' sales ']. rolling (5). mean ()

#view first 10 rows
df. head (10)

	period leads sales rolling_sales_5 rolling_leads_5
0 1 11.427457 61.417425 NaN NaN
1 2 14.588598 64.900826 NaN NaN
2 3 12.452504 66.698494 NaN NaN
3 4 11.352780 64.927513 NaN NaN
4 5 9.049441 73.720630 66.332978 11.774156
5 6 13.271988 77.687668 69.587026 12.143062
6 7 9.314157 78.125728 72.232007 11.088174
7 8 17.943687 75.280301 73.948368 12.186411
8 9 19.309592 73.181613 75.599188 13.777773
9 10 8.285389 85.272259 77.909514 13.624963
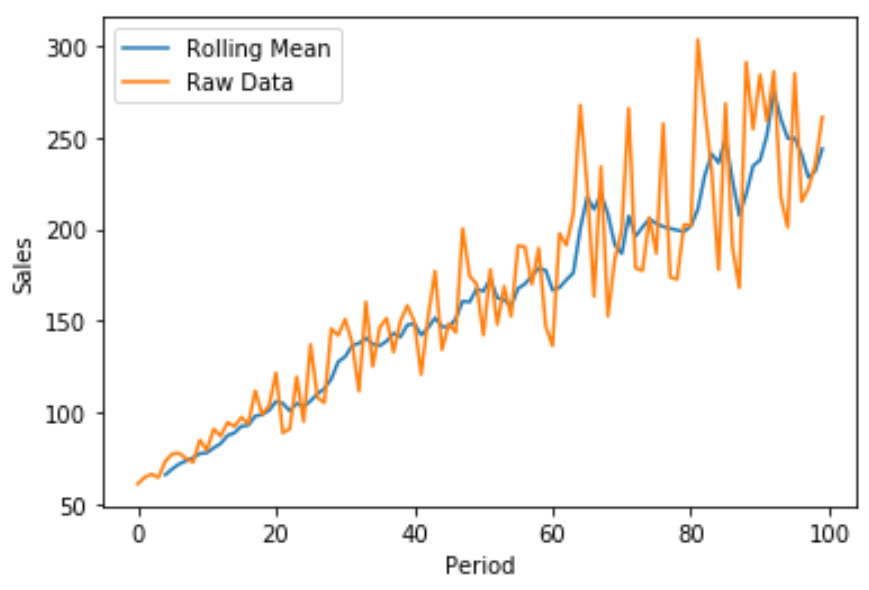
我们还可以使用 Matplotlib 创建快速线图来可视化总销售额与移动销售平均值的关系:
 import matplotlib. pyplot as plt
plt. plot (df[' rolling_sales_5 '], label=' Rolling Mean ')
plt. plot (df[' sales '], label=' Raw Data ')
plt. legend ()
plt. ylabel (' Sales ')
plt. xlabel (' Period ')
plt. show ()

蓝线显示销售的 5 个周期移动平均值,橙色线显示原始销售数据。
其他资源
以下教程解释了如何在 pandas 中执行其他常见任务: