如何用 python 创建钟形曲线
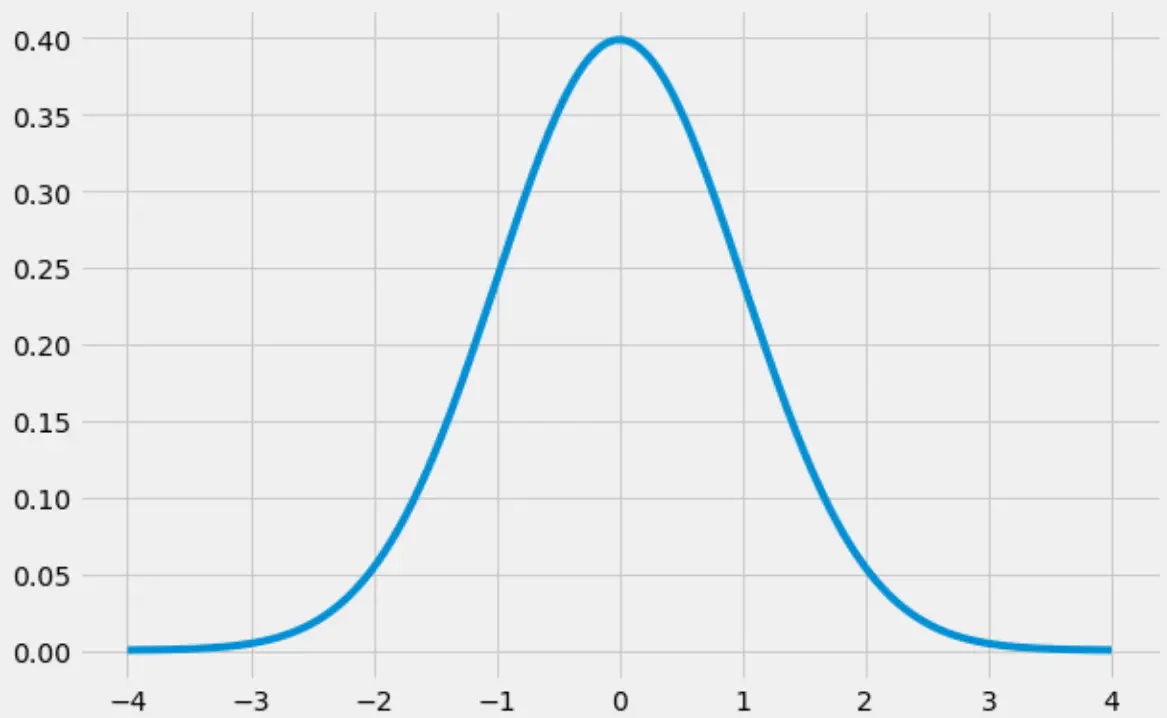
“钟形曲线”是正态分布形状的昵称,它具有明显的“钟形”形状:

本教程介绍如何在 Python 中创建钟形曲线。
如何用 Python 创建钟形曲线
以下代码演示了如何使用numpy 、 scipy和matplotlib库创建钟形曲线:
 import numpy as np
import matplotlib.pyplot as plt
from scipy.stats import norm

#create range of x-values from -4 to 4 in increments of .001
x = np.arange(-4, 4, 0.001)

#create range of y-values that correspond to normal pdf with mean=0 and sd=1
y = norm.pdf(x,0,1)

#defineplot
fig, ax = plt.subplots(figsize=(9,6))
ax.plot(x,y)

#choose plot style and display the bell curve
plt.style.use('fivethirtyeight')
plt.show()

如何用 Python 填充钟形曲线
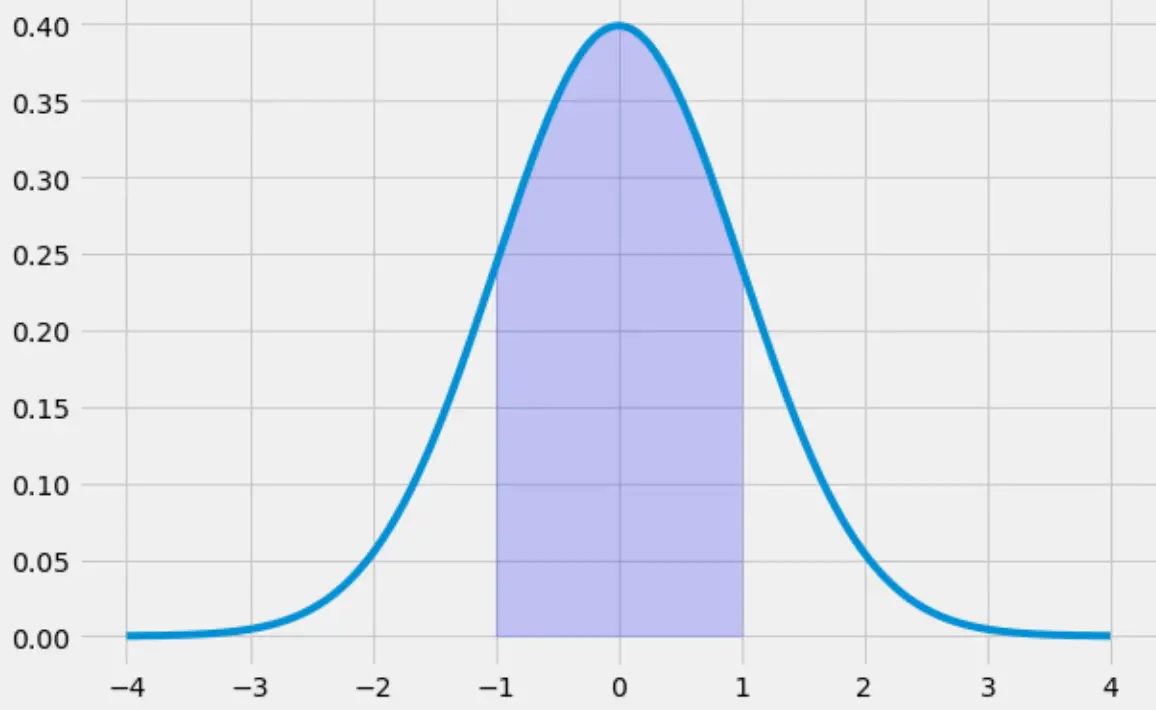
以下代码说明了如何填充从 -1 到 1 的钟形曲线下方的区域:
 x = np.arange(-4, 4, 0.001)
y = norm.pdf(x,0,1)

fig, ax = plt.subplots(figsize=(9,6))
ax.plot(x,y)

#specify the region of the bell curve to fill in
x_fill = np.arange(-1, 1, 0.001)
y_fill = norm.pdf(x_fill,0,1)
ax.fill_between(x_fill,y_fill,0, alpha=0.2, color='blue')

plt.style.use('fivethirtyeight')
plt.show()

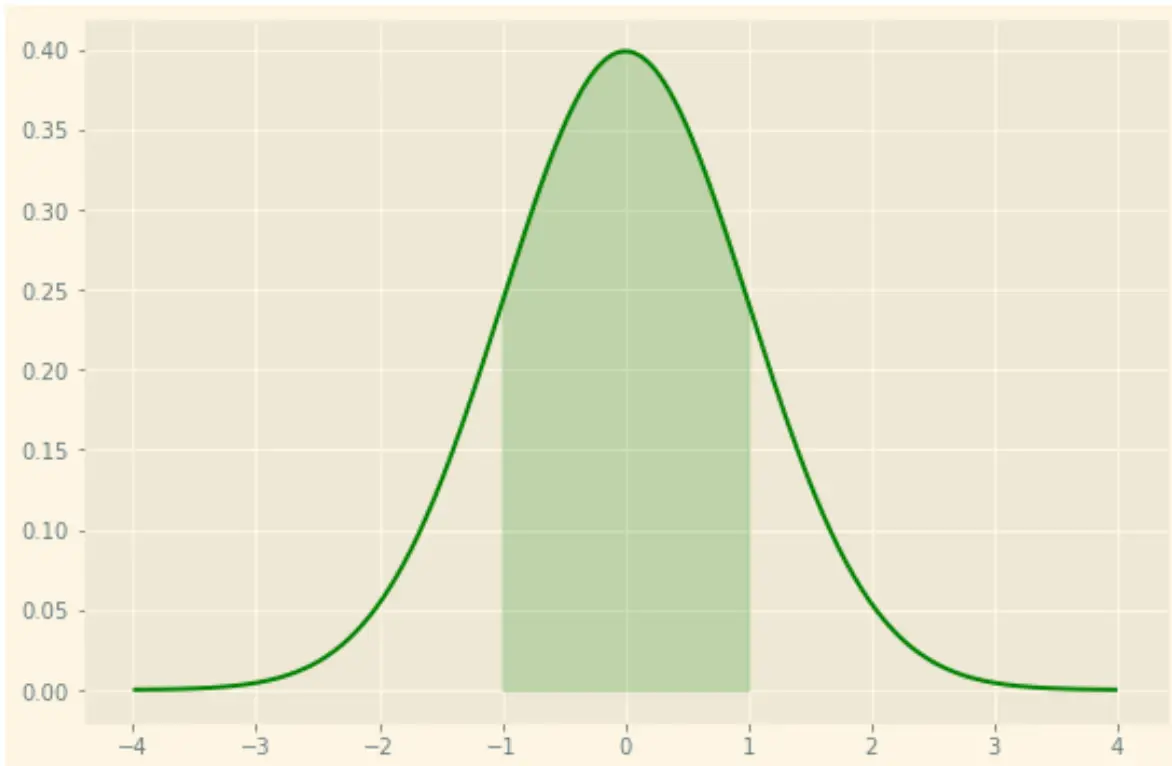
请注意,您还可以使用matplotlib 的许多样式选项来设置您想要的绘图样式。例如,您可以使用带有绿线和绿色阴影的“阳光”主题:
 x = np.arange(-4, 4, 0.001)
y = norm.pdf(x,0,1)

fig, ax = plt.subplots(figsize=(9,6))
ax.plot(x,y, color=' green ')

#specify the region of the bell curve to fill in
x_fill = np.arange(-1, 1, 0.001)
y_fill = norm.pdf(x_fill,0,1)
ax.fill_between(x_fill,y_fill,0, alpha=0.2, color=' green ')

plt.style.use(' Solarize_Light2 ')
plt.show()

您可以在此处找到 matplotlib 的完整样式表参考指南。