So fügen sie text zu matplotlib-plots hinzu (mit beispielen)
Sie können ganz einfach Text zu einem Matplotlib-Plot hinzufügen, indem Sie die Funktion matplotlib.pyplot.text() verwenden, die die folgende Syntax verwendet:
matplotlib.pyplot.text(x, y, s, fontdict=None)
Gold:
- x: Die x-Koordinate des Textes
- y: Die y-Koordinate des Textes
- s: die Textzeichenfolge
- Fontdict: ein Wörterbuch zum Überschreiben von Standardtexteigenschaften
Dieses Tutorial zeigt einige Beispiele für die praktische Verwendung dieser Funktion.
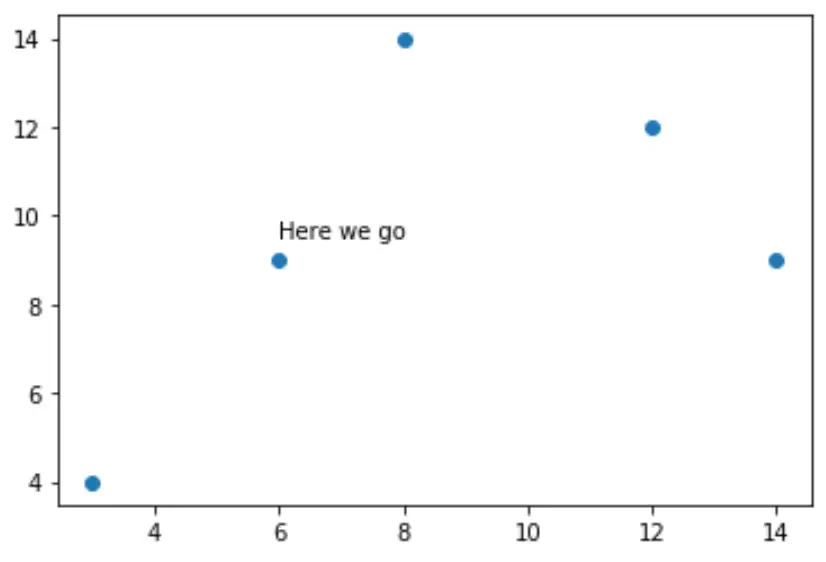
Beispiel 1: Fügen Sie einem Matplotlib-Plot eindeutigen Text hinzu
Der folgende Code zeigt, wie Sie ein Streudiagramm erstellen und dem Diagramm einen einzelnen Text hinzufügen:
 import matplotlib. pyplot as plt

#createdata
x = [3, 6, 8, 12, 14]
y = [4, 9, 14, 12, 9]

#create scatterplot
plt. scatter (x,y)

#add text at (x, y) coordinates = (6, 9.5)
plt. text (6, 9.5, ' Here we go ')

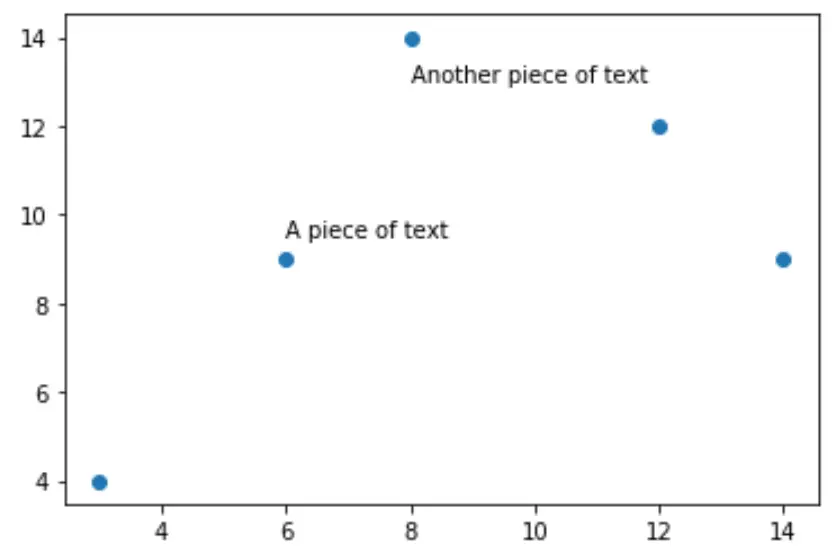
Beispiel 2: Mehrere Texte zu einem Matplotlib-Plot hinzufügen
Der folgende Code zeigt, wie Sie ein Streudiagramm erstellen und dem Diagramm mehrere Textteile hinzufügen:
 import matplotlib. pyplot as plt

#create data
x = [3, 6, 8, 12, 14]
y = [4, 9, 14, 12, 9]

#create scatterplot
plt. scatter (x,y)

#add text at (x, y) coordinates = (6, 9.5)
plt. text (6, 9.5, ' A piece of text ')

#add another piece of text
plt. text (8, 13, ' Another piece of text ')

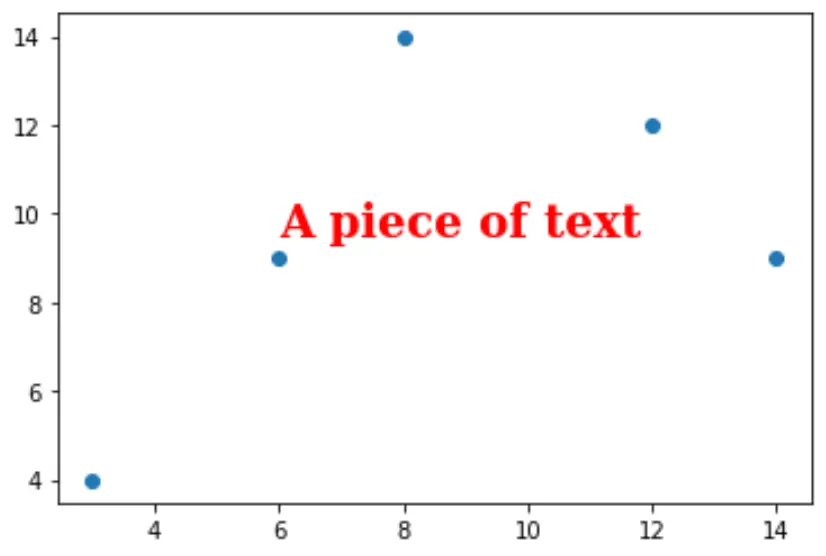
Beispiel 3: Texteigenschaften bearbeiten
Um die Texteigenschaften zu ändern, können wir ein Wörterbuch erstellen, das die Schriftarteigenschaften angibt.
Der folgende Code zeigt, wie das geht:
 import matplotlib. pyplot as plt

#createdata
x = [3, 6, 8, 12, 14]
y = [4, 9, 14, 12, 9]

#create scatterplot
plt. scatter (x,y)

font = {' family ': ' serif ',
        ' color ': ' red ',
        ' weight ': ' bold ',
        ' size ': 20
        }

#add text with custom font
plt. text (6, 9.5, ' A piece of text ', fontdict=font)

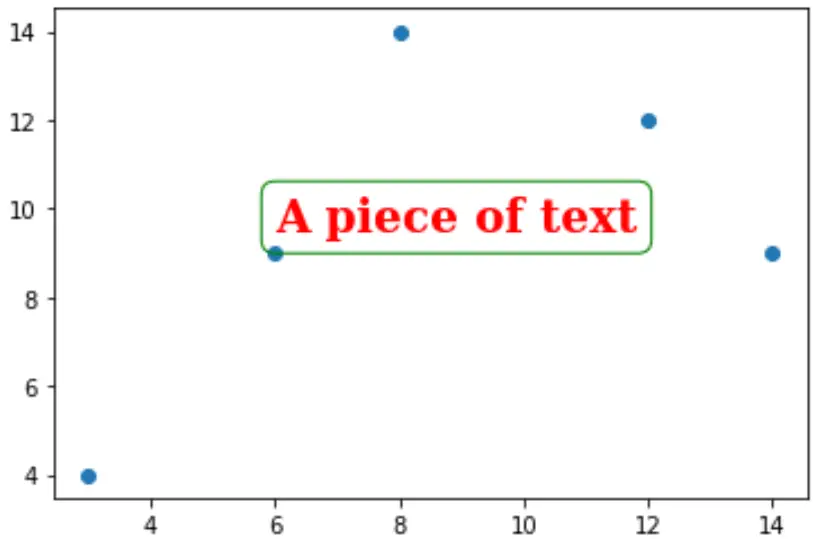
Beispiel 4: Fügen Sie einen Rahmen um den Text hinzu
Der folgende Code zeigt, wie man einen Rahmen um den Text hinzufügt:
 import matplotlib. pyplot as plt

#createdata
x = [3, 6, 8, 12, 14]
y = [4, 9, 14, 12, 9]

#create scatterplot
plt. scatter (x,y)

font = {' family ': ' serif ',
        ' color ': ' red ',
        ' weight ': ' bold ',
        ' size ': 20
        }

box = {' facecolor ': ' none ',
       ' edgecolor ': ' green ',
       ' boxstyle ': ' round '
      }

#add text with custom font
plt. text (6, 9.5, ' A piece of text ', fontdict=font, bbox=box)

Zusätzliche Ressourcen
So kommentieren Sie Matplotlib-Streudiagramme
So ändern Sie die Schriftgröße in einem Matplotlib-Plot