So erstellen sie eine glockenkurve in python
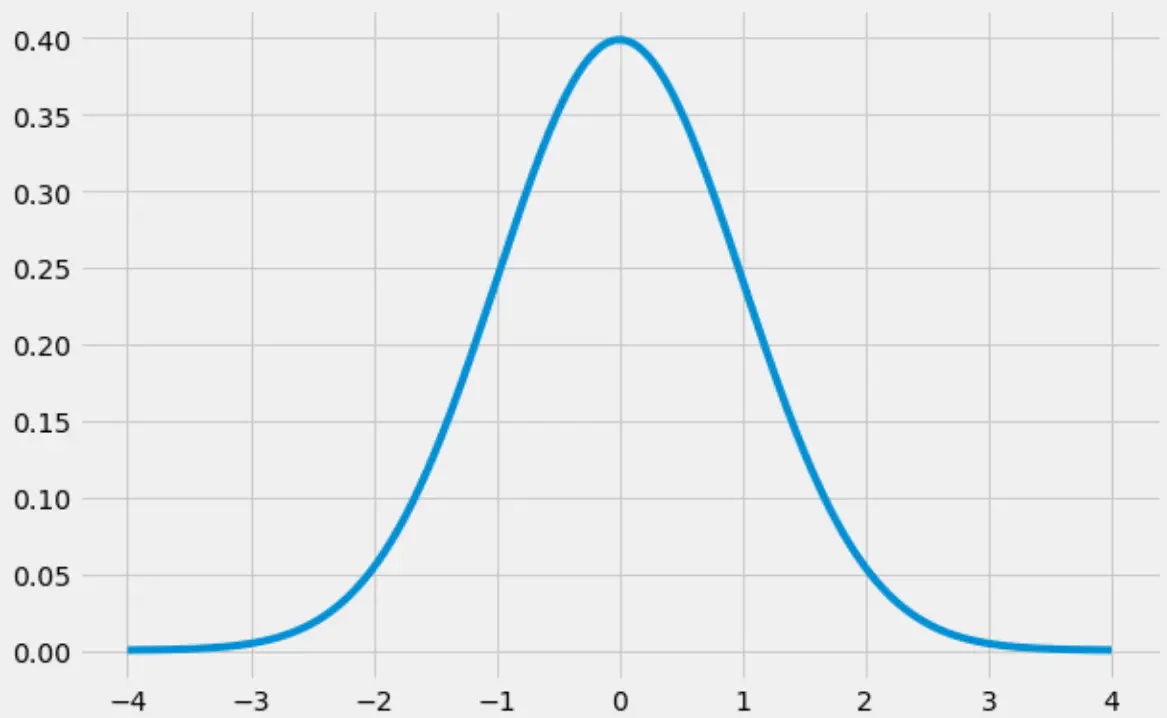
Eine „Glockenkurve“ ist der Spitzname für die Form einerNormalverteilung , die eine ausgeprägte „Glockenform“ aufweist:

In diesem Tutorial wird erläutert, wie Sie in Python eine Glockenkurve erstellen.
So erstellen Sie eine Glockenkurve in Python
Der folgende Code zeigt, wie man mit den Bibliotheken numpy , scipy und matplotlib eine Glockenkurve erstellt:
 import numpy as np
import matplotlib.pyplot as plt
from scipy.stats import norm

#create range of x-values from -4 to 4 in increments of .001
x = np.arange(-4, 4, 0.001)

#create range of y-values that correspond to normal pdf with mean=0 and sd=1
y = norm.pdf(x,0,1)

#defineplot
fig, ax = plt.subplots(figsize=(9,6))
ax.plot(x,y)

#choose plot style and display the bell curve
plt.style.use('fivethirtyeight')
plt.show()

So füllen Sie eine Glockenkurve in Python
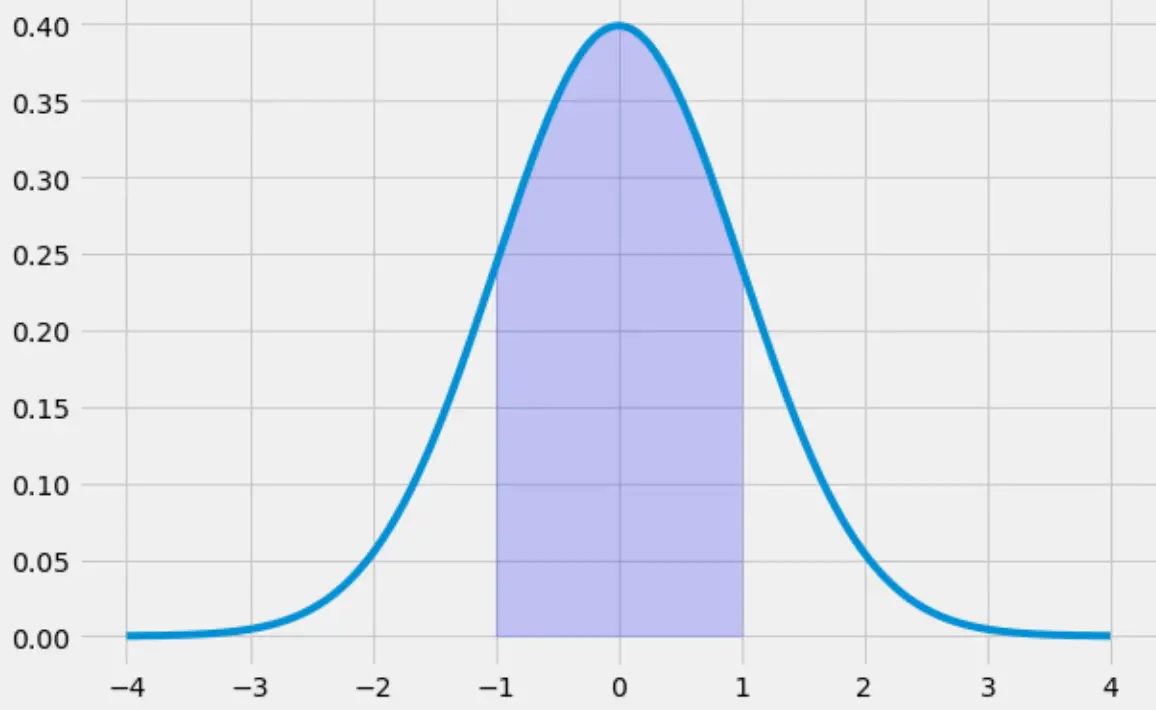
Der folgende Code veranschaulicht, wie der Bereich unter der Glockenkurve von -1 bis 1 gefüllt wird:
 x = np.arange(-4, 4, 0.001)
y = norm.pdf(x,0,1)

fig, ax = plt.subplots(figsize=(9,6))
ax.plot(x,y)

#specify the region of the bell curve to fill in
x_fill = np.arange(-1, 1, 0.001)
y_fill = norm.pdf(x_fill,0,1)
ax.fill_between(x_fill,y_fill,0, alpha=0.2, color='blue')

plt.style.use('fivethirtyeight')
plt.show()

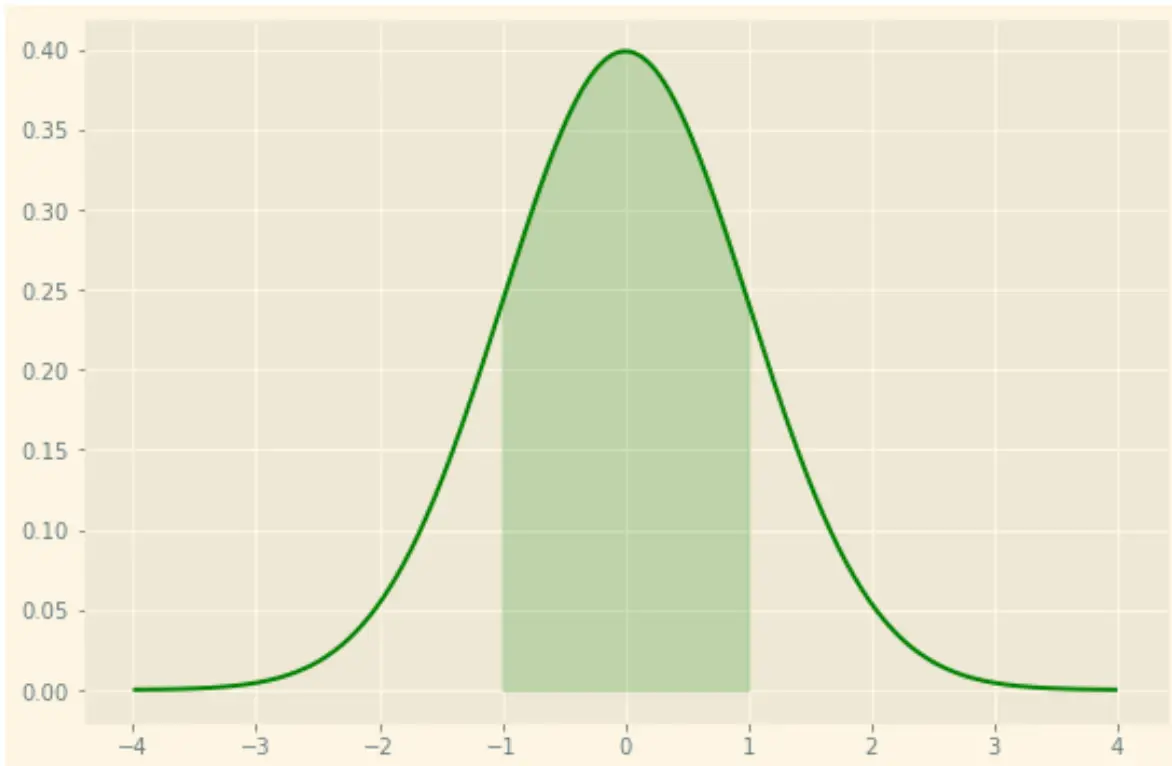
Beachten Sie, dass Sie den Plot mithilfe der zahlreichen Gestaltungsoptionen von matplotlib auch nach Ihren Wünschen gestalten können. Sie können beispielsweise ein „Sonnenlicht“-Thema mit einer grünen Linie und einer grünen Schattierung verwenden:
 x = np.arange(-4, 4, 0.001)
y = norm.pdf(x,0,1)

fig, ax = plt.subplots(figsize=(9,6))
ax.plot(x,y, color=' green ')

#specify the region of the bell curve to fill in
x_fill = np.arange(-1, 1, 0.001)
y_fill = norm.pdf(x_fill,0,1)
ax.fill_between(x_fill,y_fill,0, alpha=0.2, color=' green ')

plt.style.use(' Solarize_Light2 ')
plt.show()

Das vollständige Stylesheet-Referenzhandbuch für Matplotlib finden Sie hier .