So erhalten sie achsengrenzen in matplotlib (mit beispiel)
Sie können die folgende Syntax verwenden, um Achsengrenzen für die x- und y-Achse eines Diagramms in Matplotlib abzurufen:
 import matplotlib. pyplot as plt

#get x-axis and y-axis limits
xmin, xmax, ymin, ymax = plt. axis ()

#print axis limits
print (xmin, xmax, ymin, ymax)
Das folgende Beispiel zeigt, wie diese Syntax in der Praxis verwendet wird.
Beispiel: So erhalten Sie Achsengrenzen in Matplotlib
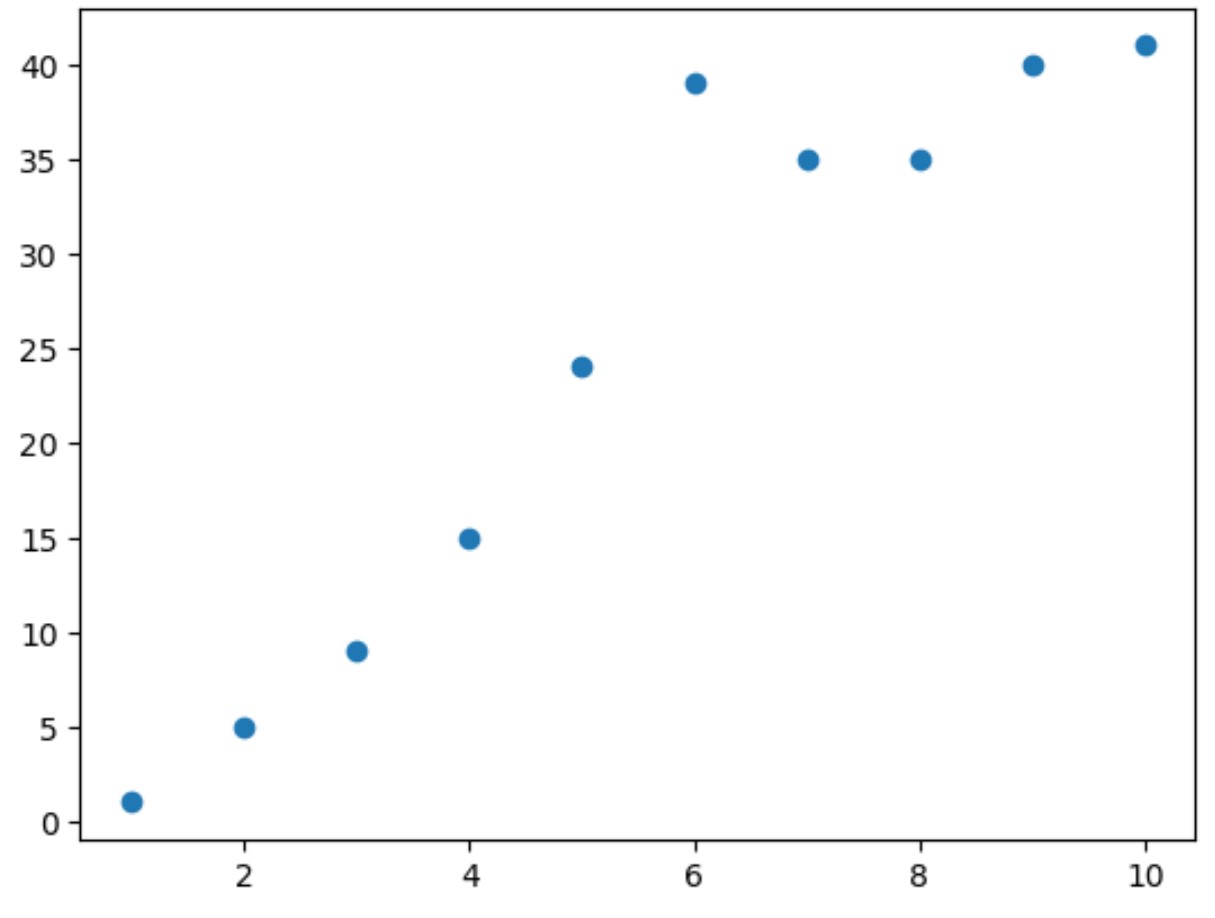
Angenommen, wir erstellen das folgende Streudiagramm in Matplotlib:
 import matplotlib. pyplot as plt

#define x and y
x = [1, 2, 3, 4, 5, 6, 7, 8, 9, 10]
y = [1, 5, 9, 15, 24, 39, 35, 35, 40, 41]

#create scatter plot of x vs. y
plt. scatter (x,y)

Wir können die folgende Syntax verwenden, um die Achsengrenzen für die x- und y-Achse des Streudiagramms zu erhalten:
 import matplotlib. pyplot as plt

#define x and y
x = [1, 2, 3, 4, 5, 6, 7, 8, 9, 10]
y = [1, 5, 9, 15, 24, 39, 35, 35, 40, 41]

#create scatter plot of x vs. y
plt. scatter (x,y)

#get x-axis and y-axis limits
xmin, xmax, ymin, ymax = plt. axis ()

#print axis limits
print (xmin, xmax, ymin, ymax)

0.55 10.45 -1.0 43.0
Aus dem Ergebnis können wir sehen:
- Minimum auf der x-Achse: 0,55
- Maximum auf der x-Achse: 10,45
- Minimum auf der Y-Achse: -1,0
- Maximum auf der Y-Achse: 43,0
Diese Werte entsprechen den im obigen Streudiagramm sichtbaren Achsengrenzen.
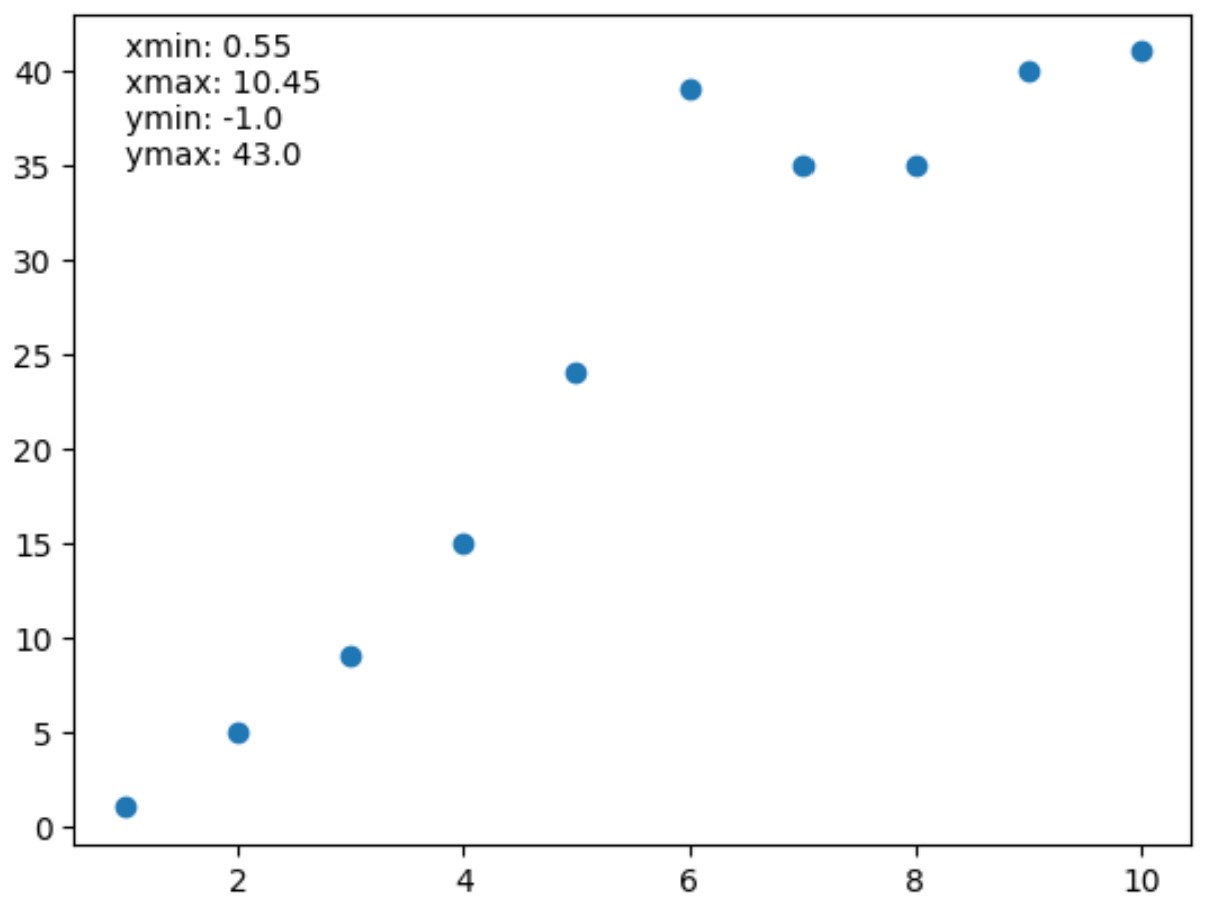
Wir können auch die Funktion annotate() verwenden, um diese Achsengrenzen als Textwerte zum Diagramm hinzuzufügen, wenn wir möchten:
 import matplotlib. pyplot as plt

#define x and y
x = [1, 2, 3, 4, 5, 6, 7, 8, 9, 10]
y = [1, 5, 9, 15, 24, 39, 35, 35, 40, 41]

#create scatter plot of x vs. y
plt. scatter (x,y)

#get x-axis and y-axis limits
xmin, xmax, ymin, ymax = plt. axis ()

#print axis limits
lims = ' xmin: ' + str(round(xmin, 2 )) + ' \n ' + \
       ' xmax: ' + str(round(xmax, 2 )) + ' \n ' + \
       ' ymin: ' + str(round(ymin, 2 )) + ' \n ' + \
       ' ymax: ' + str(round(ymax, 2 ))

#add axis limits to plot at (x,y) coordinate (1.35)
plt. annotate (lims, ( 1 , 35 ))

Zusätzliche Ressourcen
Die folgenden Tutorials erklären, wie Sie andere häufige Aufgaben in Matplotlib ausführen:
So legen Sie Achsenstriche in Matplotlib fest
So erhöhen Sie die Plotgröße in Matplotlib
So fügen Sie Text zu Matplotlib-Plots hinzu