So füllen sie bereiche zwischen zeilen in matplotlib
Mit den folgenden Funktionen können Sie den Bereich zwischen Werten in einem Matplotlib-Plot ganz einfach füllen:
- fill_between() : Füllt den Bereich zwischen zwei horizontalen Kurven.
- fill_betweenx() : Füllt den Bereich zwischen zwei vertikalen Kurven.
Dieses Tutorial bietet Beispiele für die praktische Verwendung jeder dieser Funktionen.
Beispiel 1: Füllen Sie den Bereich zwischen zwei horizontalen Linien
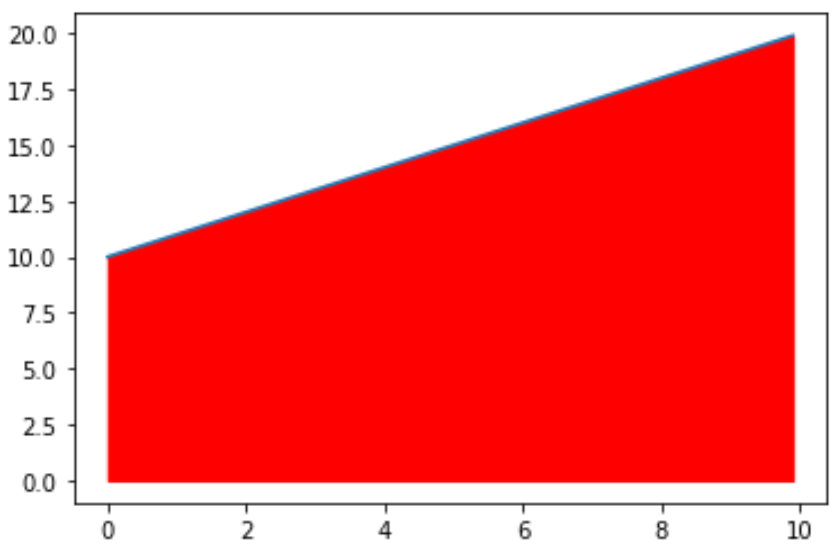
Der folgende Code zeigt, wie der Bereich zwischen zwei horizontalen Linien gefüllt wird:
 import matplotlib. pyplot as plt
import numpy as np

#define x and y values
x = np. arange (0,10,0.1)
y = np. arange (10,20,0.1)

#create plot of values
plt. plot (x,y)

#fill in area between the two lines
plt. fill_between (x,y,color=' red ')
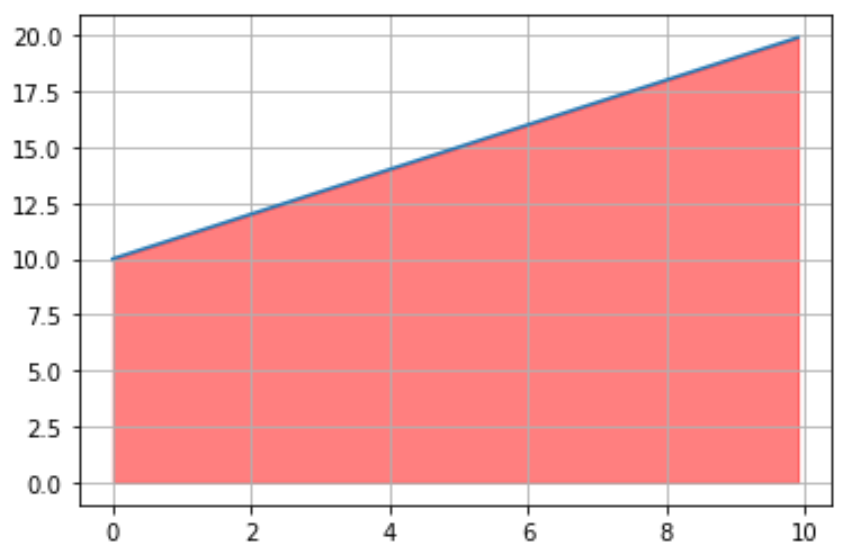
Beachten Sie, dass wir auch die Funktion plt.grid() verwenden können, um dem Diagramm ein Raster hinzuzufügen, um einfacher zu sehen, welche Werte gefüllt sind:
 import matplotlib. pyplot as plt
import numpy as np

#define x and y values
x = np. arange (0,10,0.1)
y = np. arange (10,20,0.1)

#create plot of values
plt. plot (x,y)

#fill in area between the two lines
plt. fill_between (x, y, color=' red ', alpha= .5 )

#add gridlines
plt. grid ()
Beispiel 2: Füllen Sie den Bereich unter einer Kurve
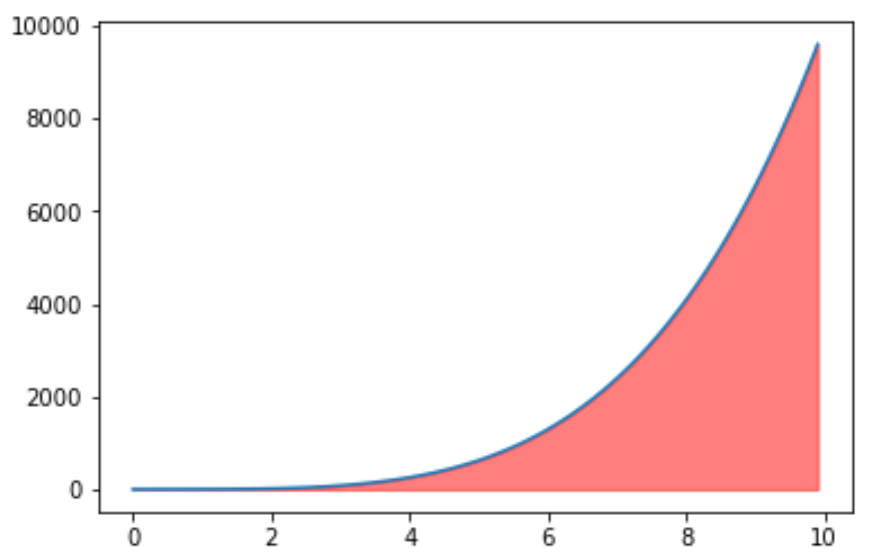
Der folgende Code zeigt, wie der Bereich unter einer Kurve gefüllt wird:
 import matplotlib. pyplot as plt
import numpy as np

#define x and y values
x = np. arange (0,10,0.1)
y = x**4

#create plot of values
plt. plot (x,y)

#fill in area between the two lines
plt. fill_between (x, y, color=' red ', alpha= .5 )
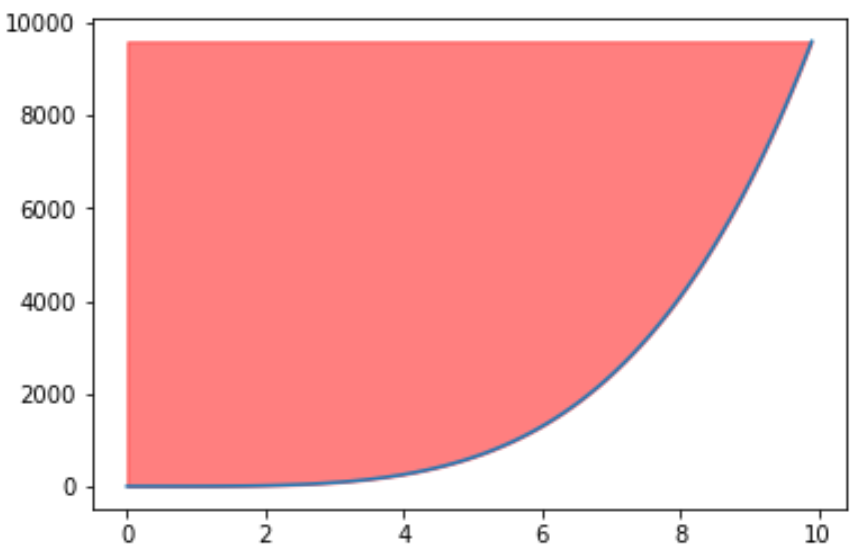
Beispiel 3: Füllen Sie den Bereich über einer Kurve
Der folgende Code zeigt, wie der Bereich über einer Kurve gefüllt wird:
 import matplotlib. pyplot as plt
import numpy as np

#define x and y values
x = np. arange (0,10,0.1)
y = x**4

#create plot of values
plt. plot (x,y)

#fill in area between the two lines
plt. fill_between (x, y, np. max (y), color=' red ', alpha= .5 )
Beispiel 4: Füllen Sie den Bereich zwischen zwei vertikalen Linien
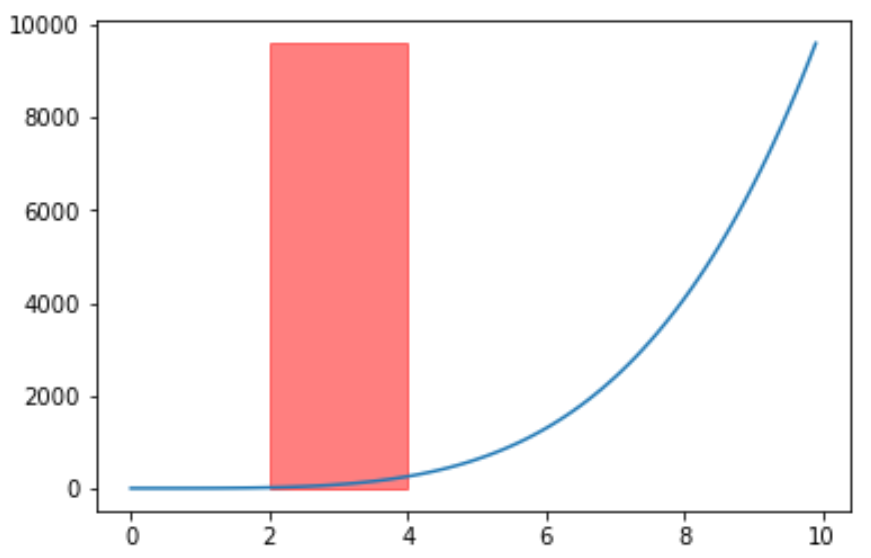
Der folgende Code zeigt, wie Sie mit der Funktion fill_betweenx() den Bereich zwischen zwei vertikalen Linien füllen:
 import matplotlib. pyplot as plt
import numpy as np

#define x and y values
x = np. arange (0,10,0.1)
y = np. arange (10,20,0.1)

#create plot of values
plt. plot (x,y)

#fill in area between the two lines
plt. fill_betweenx (y, 2, 4, color=' red ', alpha= .5 )
