So passen sie die unterplotgröße in matplotlib an
Sie können die folgende Syntax verwenden, um die Größe von Unterplots in Matplotlib anzupassen:
 #specify one size for all subplots
fig, ax = plt. subplots (2, 2, figsize=(10,7))

#specify individual sizes for subplots
fig, ax = plt. subplots (1, 2, gridspec_kw={' width_ratios ': [3, 1]})
Die folgenden Beispiele zeigen, wie Sie diese Syntax in der Praxis anwenden können.
Beispiel 1: Geben Sie eine Größe für alle Unterplots an
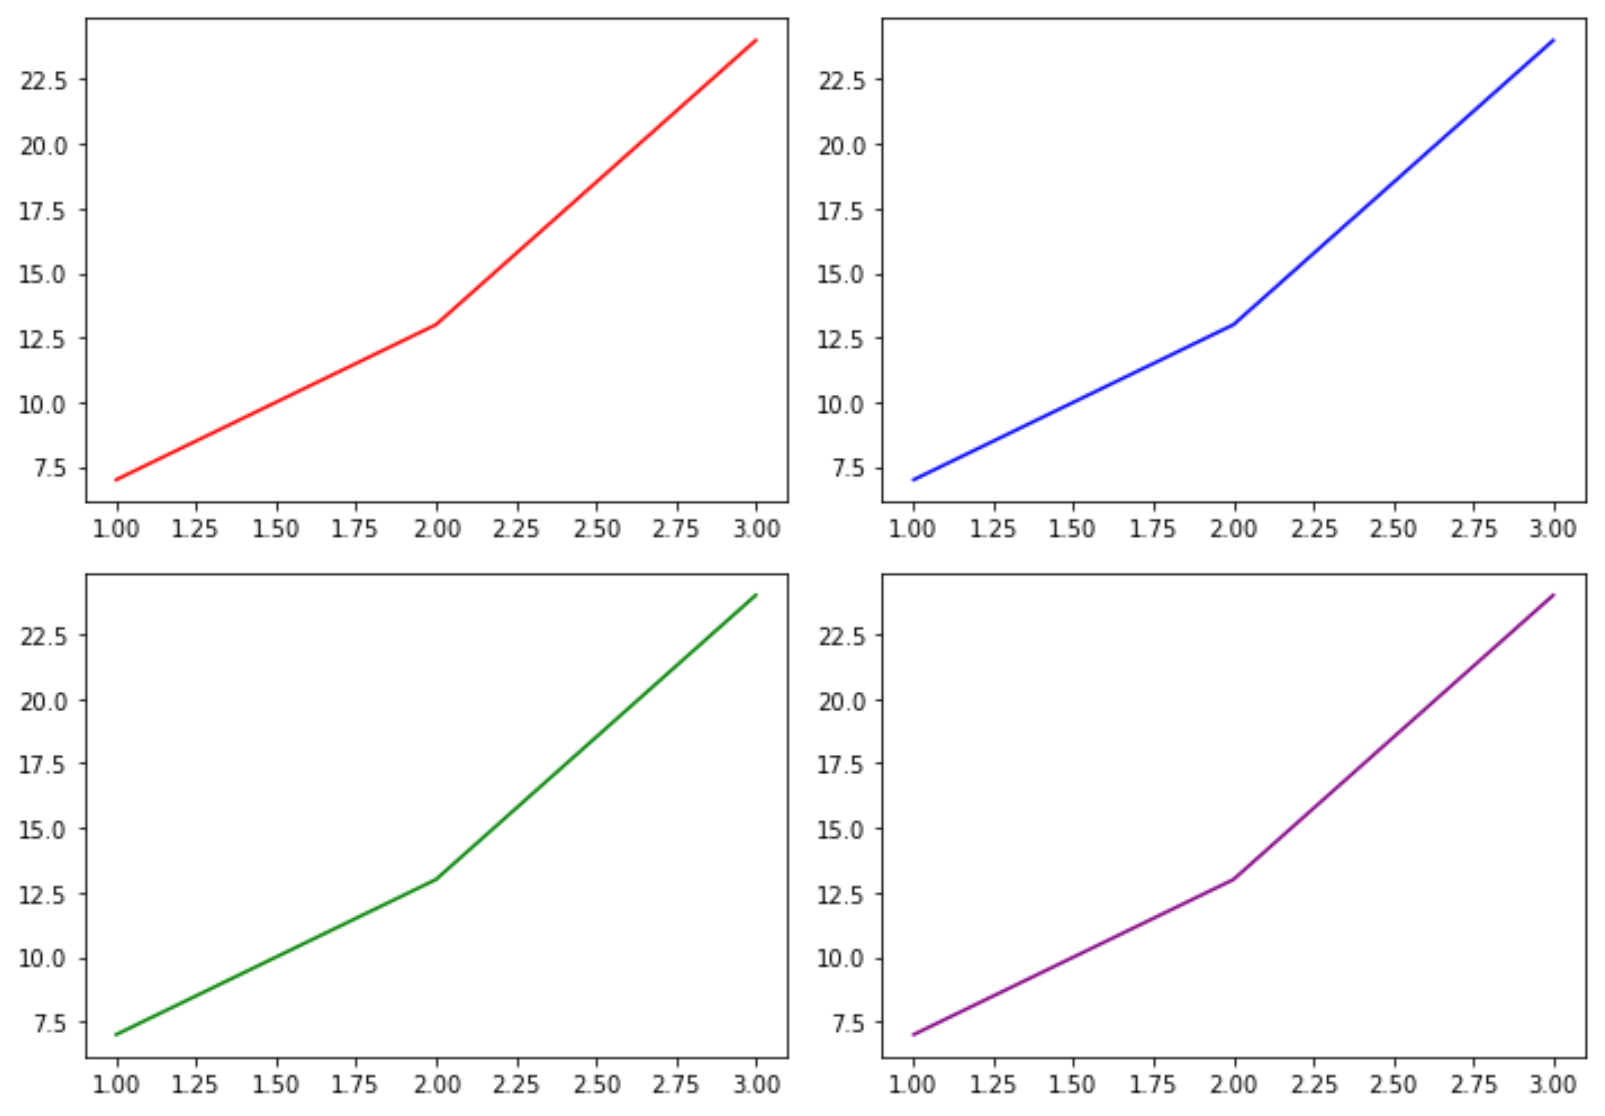
Der folgende Code zeigt, wie man eine Größe für alle Unterplots angibt:
 import matplotlib. pyplot as plt

#define subplots
fig, ax = plt. subplots (2, 2, figsize=(10,7))
fig. tight_layout ()

#define data
x = [1, 2, 3]
y = [7, 13, 24]

#create subplots
ax[0, 0]. plot (x,y,color=' red ')
ax[0, 1]. plot (x,y,color=' blue ')
ax[1, 0]. plot (x,y,color=' green ')
ax[1, 1]. plot (x,y,color=' purple ')

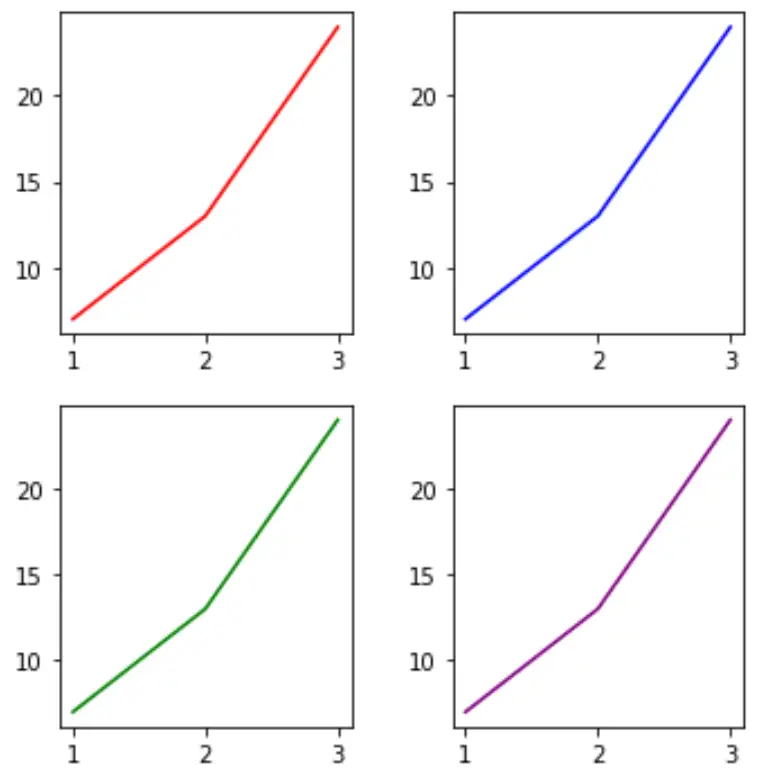
Wir können die Größe der Subtraces leicht ändern, indem wir die Werte des Arguments figsize ändern:
 import matplotlib. pyplot as plt

#define subplots
fig, ax = plt. subplots (2, 2, figsize=(5,5))
fig. tight_layout ()

#define data
x = [1, 2, 3]
y = [7, 13, 24]

#create subplots
ax[0, 0]. plot (x,y,color=' red ')
ax[0, 1]. plot (x,y,color=' blue ')
ax[1, 0]. plot (x,y,color=' green ')
ax[1, 1]. plot (x,y,color=' purple ')

Beispiel 2: Geben Sie die Größe der einzelnen Unterplots an
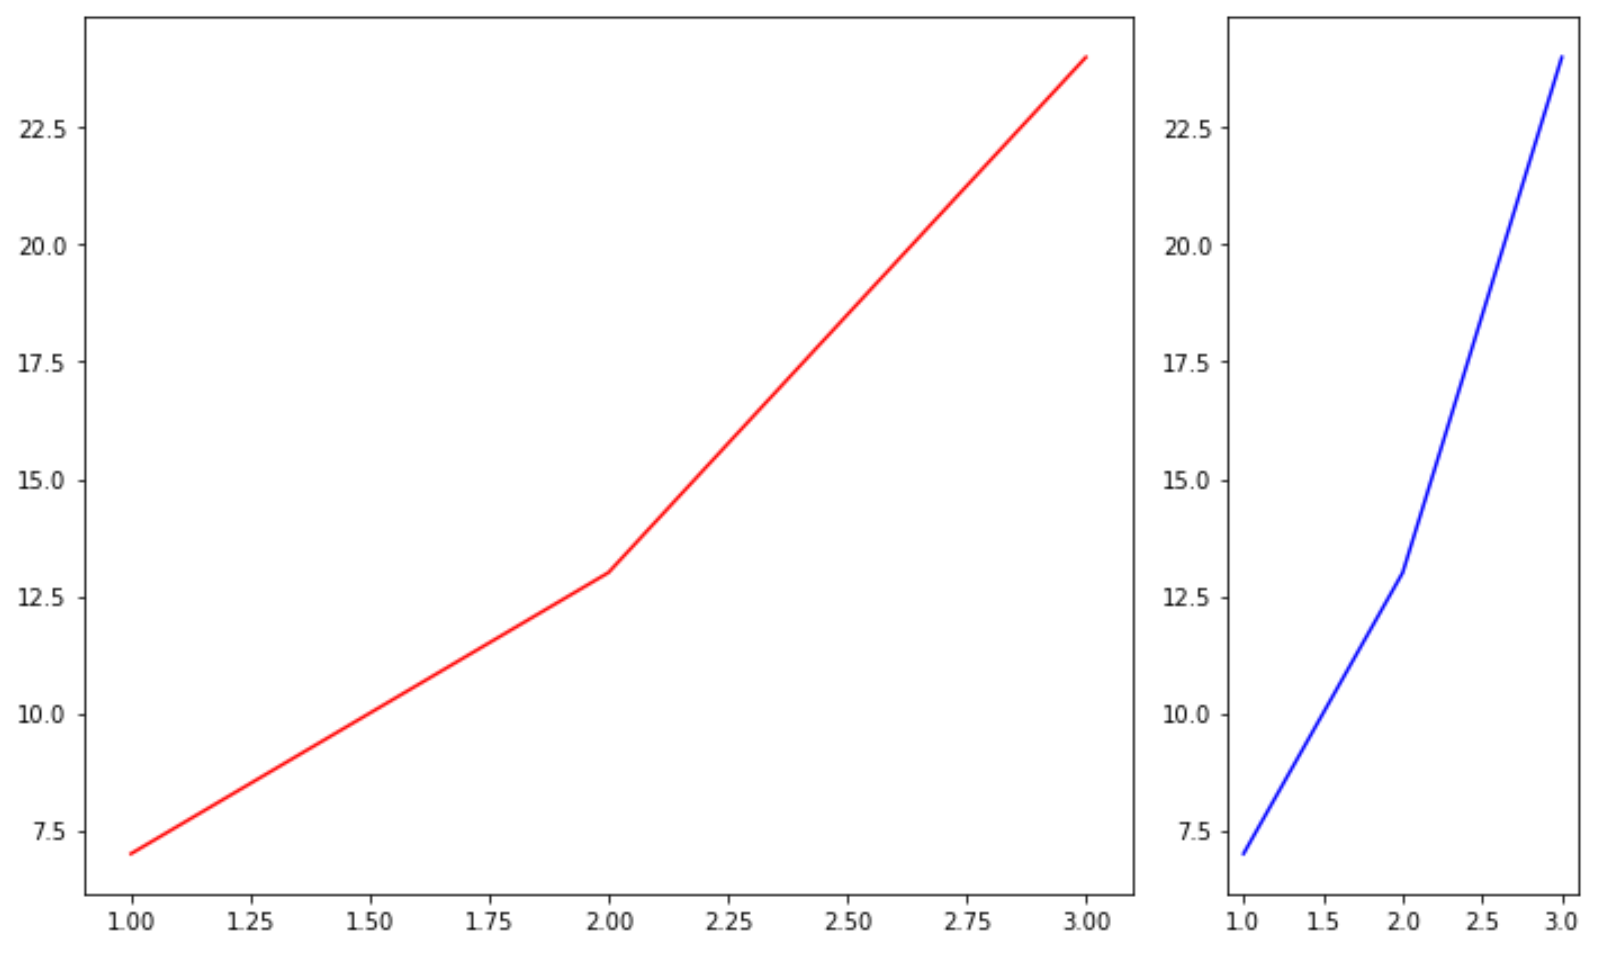
Der folgende Code zeigt, wie unterschiedliche Größen für einzelne Unterplots angegeben werden:
 import matplotlib. pyplot as plt

#define subplots
fig, ax = plt. subplots (1, 2, gridspec_kw={' width_ratios ': [3, 1]})
fig. tight_layout ()

#define data
x = [1, 2, 3]
y = [7, 13, 24]

#create subplots
ax[0]. plot (x,y,color=' red ')
ax[1]. plot (x,y,color=' blue ')

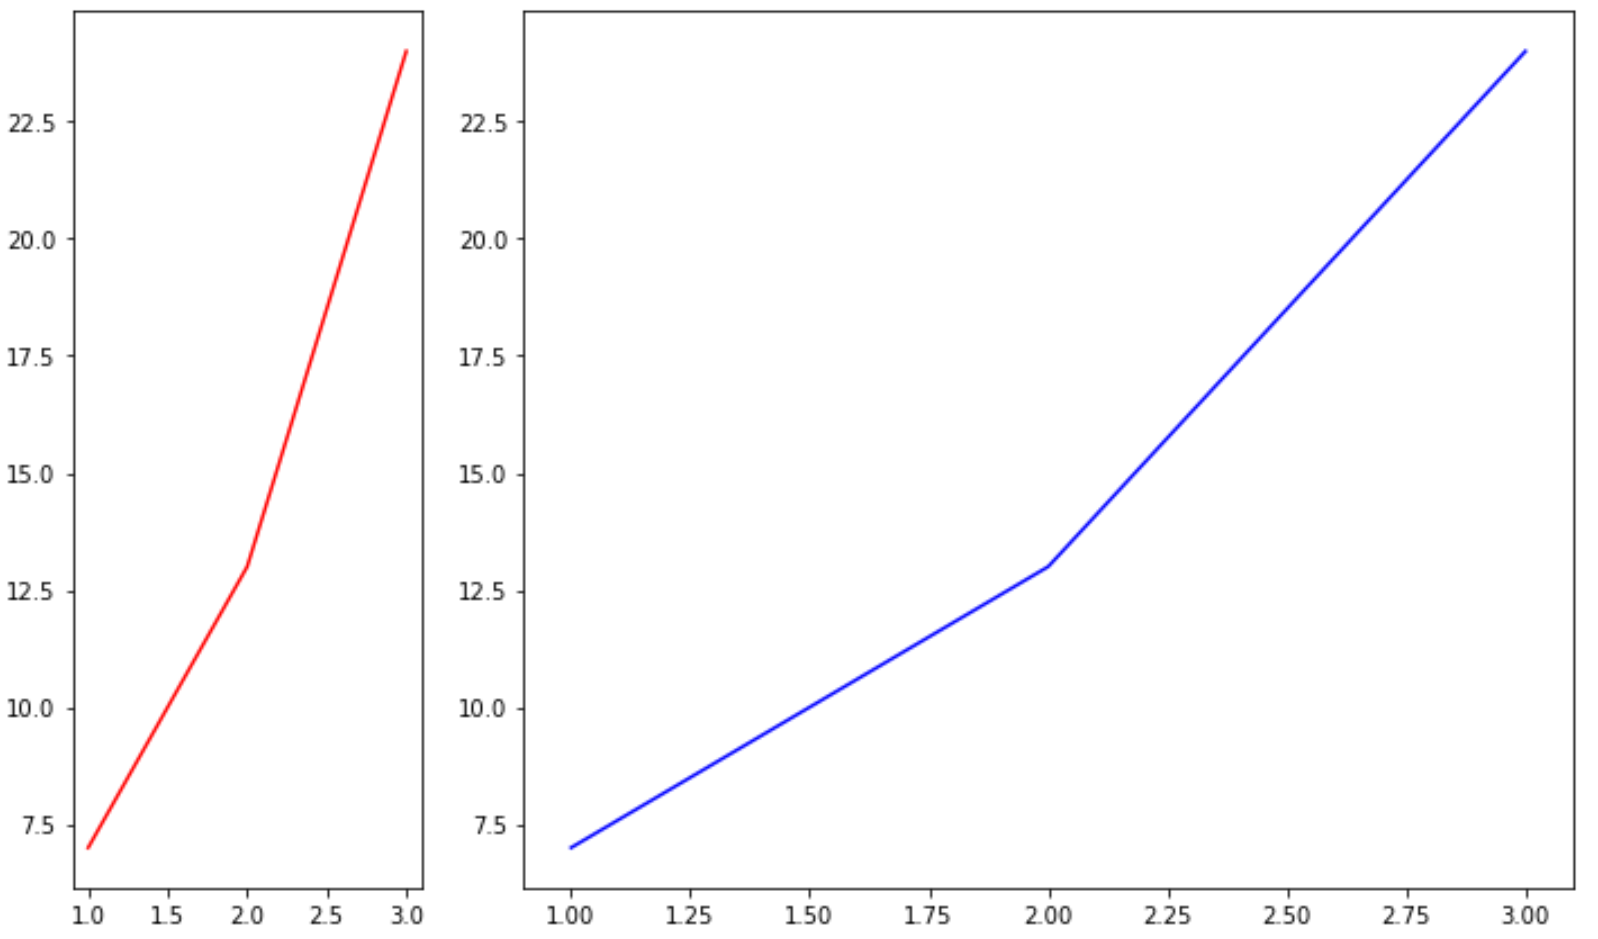
Wir können die Größe der Subtraces leicht ändern, indem wir die Werte im Argument width_ratios ändern:
 import matplotlib. pyplot as plt

#define subplots
fig, ax = plt. subplots (1, 2, gridspec_kw={' width_ratios ': [1, 3]})
fig. tight_layout ()

#define data
x = [1, 2, 3]
y = [7, 13, 24]

#create subplots
ax[0]. plot (x,y,color=' red ')
ax[1]. plot (x,y,color=' blue ')

Zusätzliche Ressourcen
So fügen Sie Plots in Matplotlib Titel hinzu
So legen Sie Achsenbereiche in Matplotlib fest
So legen Sie X-Achsenwerte in Matplotlib fest