So legen sie das seitenverhältnis in matplotlib fest
Das Seitenverhältnis eines Matplotlib-Diagramms bezieht sich auf den Aspekt der Achsenskalierung, also das Verhältnis der y-Einheit zur x-Einheit.
Dieses Verhältnis kann mit der Funktion matplotlib.axes.Axes.set_aspect() geändert werden.
Unter der Haube ändert die Funktion set_aspect() tatsächlich das sogenannte Datenkoordinatensystem , in der Praxis möchten wir jedoch normalerweise das Anzeigekoordinatensystem ändern.
Um diese Konvertierung zu erleichtern, können wir diesen Code verwenden:
 #define y-unit to x-unit ratio
ratio = 1.0

#get x and y limits
x_left, x_right = ax. get_xlim ()
y_low, y_high = ax. get_ylim ()

#set aspect ratio
ax. set_aspect ( abs ((x_right-x_left)/(y_low-y_high))*ratio)
Sehen wir uns ein Beispiel für die praktische Verwendung dieser Funktion an.
Schritt 1: Erstellen Sie ein einfaches Matplotlib-Diagramm
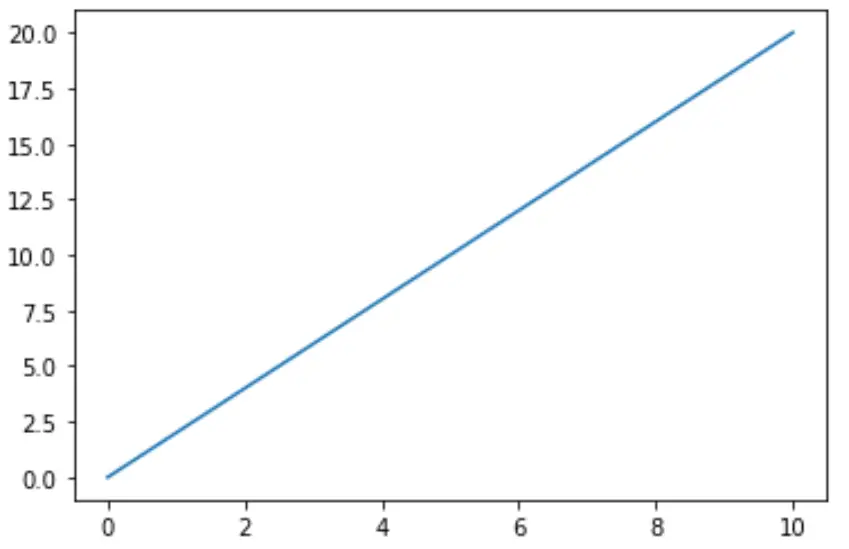
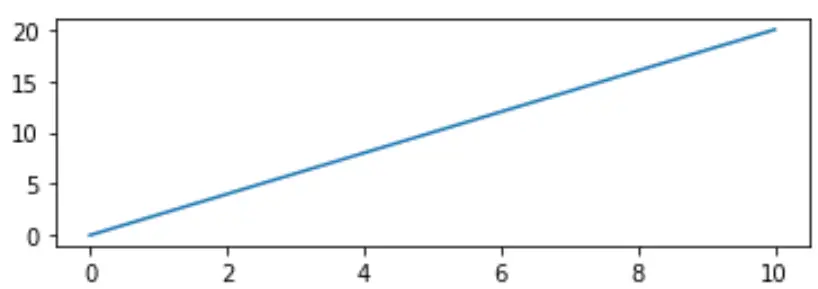
Erstellen wir zunächst ein einfaches Liniendiagramm mit Matplotlib:
 import matplotlib.pyplot as plt

#define matplotlib figure and axis
fig, ax = plt. subplots ()

#create simple line plot
ax. plot ([0, 10],[0, 20])

#displayplot
plt. show ()
Schritt 2: Stellen Sie das Seitenverhältnis ein (falsch)
Beachten Sie, dass die x-Achse länger ist als die y-Achse. Versuchen wir, das Seitenverhältnis auf 1 zu setzen, das heißt, die x-Achse und die y-Achse sollten gleich sein:
 import matplotlib.pyplot as plt

#define matplotlib figure and axis
fig, ax = plt. subplots ()

#create simple line plot
ax. plot ([0, 10],[0, 20])

#attempt to set aspect ratio to 1
ax. set_aspect (1)

#displayplot
plt. show ()
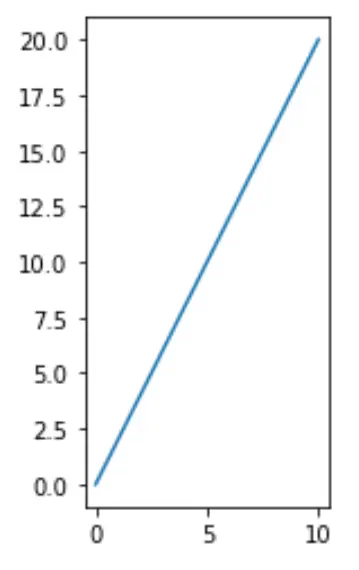
Beachten Sie, dass dies nicht wie erwartet funktioniert hat. Die y-Achse ist viel länger als die x-Achse.
Schritt 3: Stellen Sie das Seitenverhältnis ein (richtig)
Der folgende Code zeigt, wie Sie mit einer einfachen Berechnung das richtige Seitenverhältnis festlegen:
 import matplotlib.pyplot as plt

#define matplotlib figure and axis
fig, ax = plt. subplots ()

#create simple line plot
ax. plot ([0, 10],[0, 20])

#set aspect ratio to 1
ratio = 1.0
x_left, x_right = ax. get_xlim ()
y_low, y_high = ax. get_ylim ()
ax. set_aspect ( abs ((x_right-x_left)/(y_low-y_high))*ratio)

#displayplot
plt. show ()
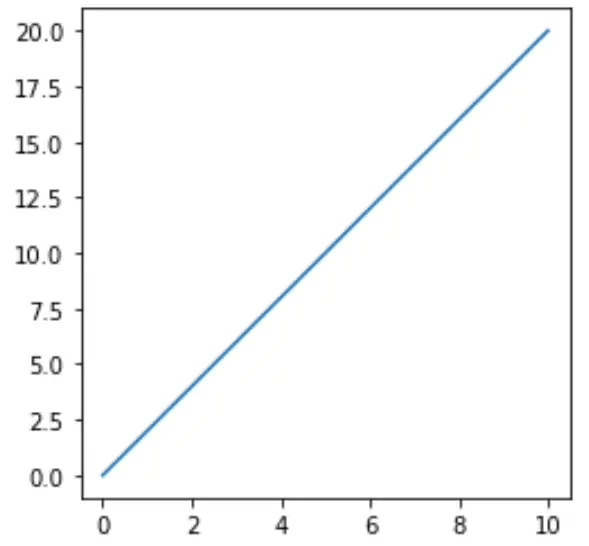
Beachten Sie, dass dieser Plot das erwartete Seitenverhältnis aufweist. Die x-Achse und die y-Achse sind gleich lang.
Schritt 4: Passen Sie das Seitenverhältnis nach Ihren Wünschen an
Wenn wir möchten, dass die y-Achse länger als die x-Achse ist, können wir einfach angeben, dass das Seitenverhältnis eine Zahl größer als 1 ist:
 import matplotlib.pyplot as plt

#define matplotlib figure and axis
fig, ax = plt. subplots ()

#create simple line plot
ax. plot ([0, 10],[0, 20])

#set aspect ratio to 3
ratio = 3
x_left, x_right = ax. get_xlim ()
y_low, y_high = ax. get_ylim ()
ax. set_aspect ( abs ((x_right-x_left)/(y_low-y_high))*ratio)

#displayplot
plt. show ()
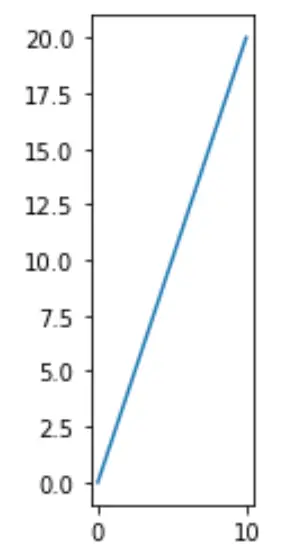
Und wenn wir möchten, dass die y-Achse kürzer als die x-Achse ist, können wir einfach angeben, dass das Seitenverhältnis eine Zahl kleiner als 1 ist:
 import matplotlib.pyplot as plt

#define matplotlib figure and axis
fig, ax = plt. subplots ()

#create simple line plot
ax. plot ([0, 10],[0, 20])

#set aspect ratio to .3
ratio = .3
x_left, x_right = ax. get_xlim ()
y_low, y_high = ax. get_ylim ()
ax. set_aspect ( abs ((x_right-x_left)/(y_low-y_high))*ratio)

#displayplot
plt. show ()
Weitere Matplotlib-Tutorials finden Sie hier .