एसएएस: मानक त्रुटि पट्टियों के साथ औसत कैसे प्लॉट करें
आप समूह द्वारा मानक त्रुटि पट्टियों के साथ औसत मानों का प्लॉट बनाने के लिए एसएएस में निम्नलिखित सिंटैक्स का उपयोग कर सकते हैं:
 /*calculate mean and standard error of points for each team*/
proc sql ;
create table groupPlot as
select
    team,
    mean(points) as meanPoints,
    mean(points) - stderr (points) as lowStdPoints,
    mean(points) + stderr (points) as highStdPoints
from my_data
group by team;
quit ;

/*create plot with mean and standard error bars of points for each team*/
proc sgplot data =groupPlot;
scatter x =team y =meanPoints /
    yerrorlower =lowStdPoints yerrorupper =highStdPoints group =team;
series x =team y =meanPoints / group =team;
run ;
यह विशेष उदाहरण डेटा सेट में टीम वेरिएबल द्वारा समूहीकृत पॉइंट वेरिएबल के औसत मूल्य की गणना करने के लिए PROC SQL का उपयोग करता है।
फिर हम एक प्लॉट बनाने के लिए PROC SGPLOT का उपयोग करते हैं जो टीम वेरिएबल द्वारा समूहीकृत मानक त्रुटि पट्टियों के साथ पॉइंट वेरिएबल का औसत मूल्य दिखाता है।
निम्नलिखित उदाहरण दिखाता है कि व्यवहार में इस वाक्यविन्यास का उपयोग कैसे करें।
उदाहरण: एसएएस में स्टैंडर्ड एरर बार्स के साथ प्लॉटिंग का मतलब
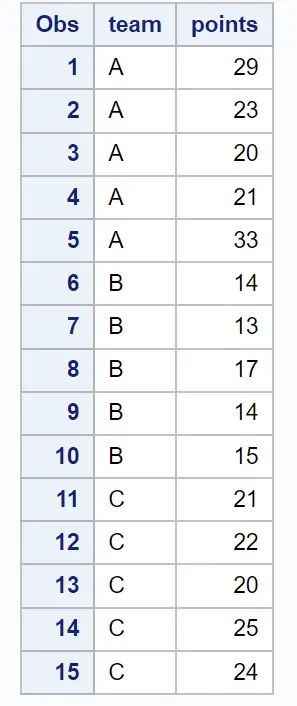
मान लीजिए कि हमारे पास निम्नलिखित डेटासेट है जिसमें विभिन्न टीमों के बास्केटबॉल खिलाड़ियों द्वारा बनाए गए अंकों के बारे में जानकारी है:
 /*create dataset*/
data my_data;
    input team $points;
    datalines ;
At 29
At 23
At 20
At 21
At 33
B14
B 13
B17
B14
B15
C 21
C22
C 20
C25
C24
;
run ;

/*view dataset*/
proc print data =my_data;
मान लीजिए कि हम प्रत्येक टीम के लिए मानक त्रुटि पट्टियों के साथ औसत बिंदु मान दर्शाने वाला एक चार्ट बनाना चाहते हैं।
ऐसा करने के लिए हम निम्नलिखित सिंटैक्स का उपयोग कर सकते हैं:
 /*calculate mean and standard error of points for each team*/
proc sql ;
create table groupPlot as
select
    team,
    mean(points) as meanPoints,
    mean(points) - stderr (points) as lowStdPoints,
    mean(points) + stderr (points) as highStdPoints
from my_data
group by team;
quit ;

/*create plot with mean and standard error bars of points for each team*/
proc sgplot data =groupPlot;
scatter x =team y =meanPoints /
    yerrorlower =lowStdPoints yerrorupper =highStdPoints group =team;
series x =team y =meanPoints / group =team;
run ;
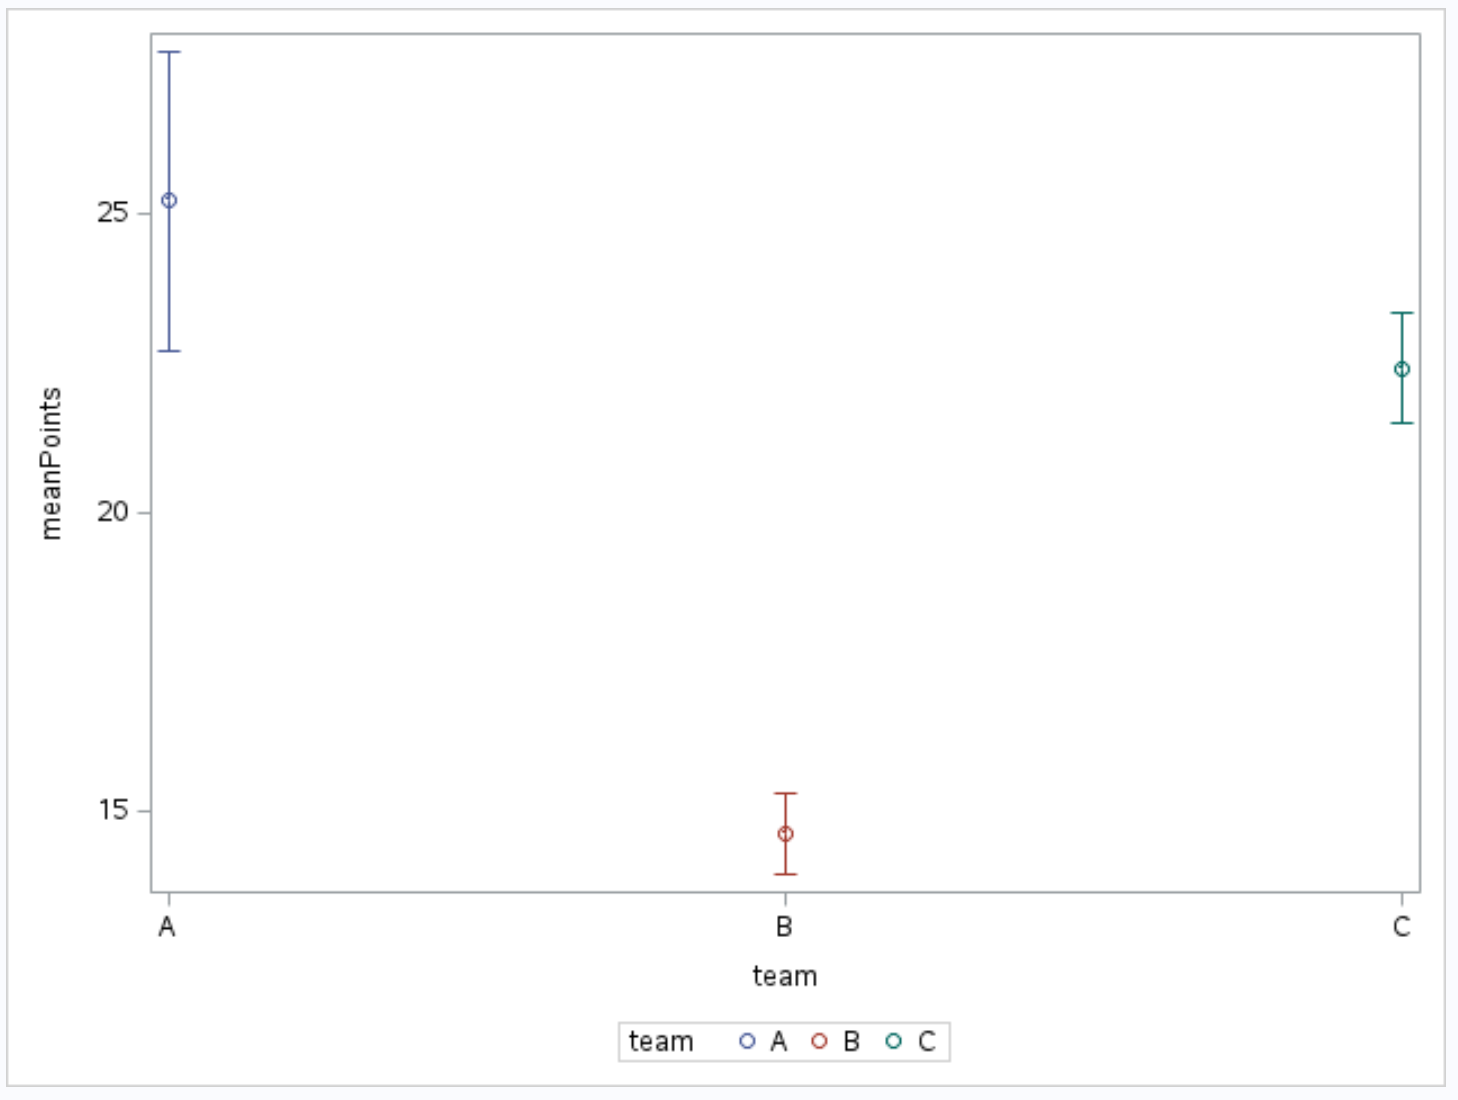
छोटे वृत्त प्रत्येक टीम के लिए अंकों का औसत मूल्य दर्शाते हैं और वृत्तों से फैली हुई पट्टियाँ प्रत्येक टीम के लिए अंकों की मानक त्रुटि दर्शाती हैं।
माध्य और मानक त्रुटि के वास्तविक मान देखने के लिए हम PROC SQL का उपयोग करके बनाई गई तालिका को भी प्रिंट कर सकते हैं:
 /*print mean and standard error of points for each team*/
proc print data =groupPlot;
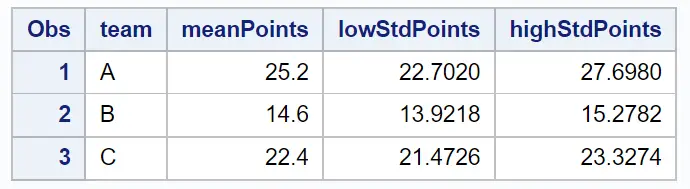
इस तालिका के मान ऊपर ग्राफ़ में दिखाए गए मानों के अनुरूप हैं।
अतिरिक्त संसाधन
निम्नलिखित ट्यूटोरियल बताते हैं कि एसएएस में अन्य चार्ट कैसे बनाएं:
एसएएस में लाइन प्लॉट कैसे बनाएं
एसएएस में समूह द्वारा बॉक्सप्लॉट कैसे बनाएं
एसएएस में रिग्रेशन लाइन के साथ स्कैटरप्लॉट कैसे बनाएं
लेखक के बारे में
डॉ. बेंजामिन एंडरसन
नमस्ते, मैं बेंजामिन हूं, एक सेवानिवृत्त सांख्यिकी प्रोफेसर जो अब समर्पित Statorials शिक्षक बन गया है। सांख्यिकी के क्षेत्र में व्यापक अनुभव और विशेषज्ञता के साथ, मैं Statorials के माध्यम से छात्रों को सशक्त बनाने के लिए अपना ज्ञान साझा करने के लिए उत्सुक हूं। अधिक जाने