मैटप्लोटलिब सबप्लॉट्स के बीच रिक्ति को कैसे समायोजित करें
आप अक्सर Matplotlib में एकाधिक प्लॉट को एक-दूसरे के बगल में प्रदर्शित करने के लिए सबप्लॉट का उपयोग कर सकते हैं। दुर्भाग्य से, ये सबप्लॉट डिफ़ॉल्ट रूप से ओवरलैप होते हैं।
इस समस्या को हल करने का सबसे आसान तरीका Matplotlib Tight_layout() फ़ंक्शन का उपयोग करना है। यह ट्यूटोरियल बताता है कि व्यवहार में इस फ़ंक्शन का उपयोग कैसे करें।
सबप्लॉट बनाएं
2 कॉलम और 2 पंक्तियों में 4 सबप्लॉट की निम्नलिखित व्यवस्था पर विचार करें:
 import matplotlib.pyplot as plt

#define subplots
fig, ax = plt. subplots (2, 2)

#display subplots
plt. show ()
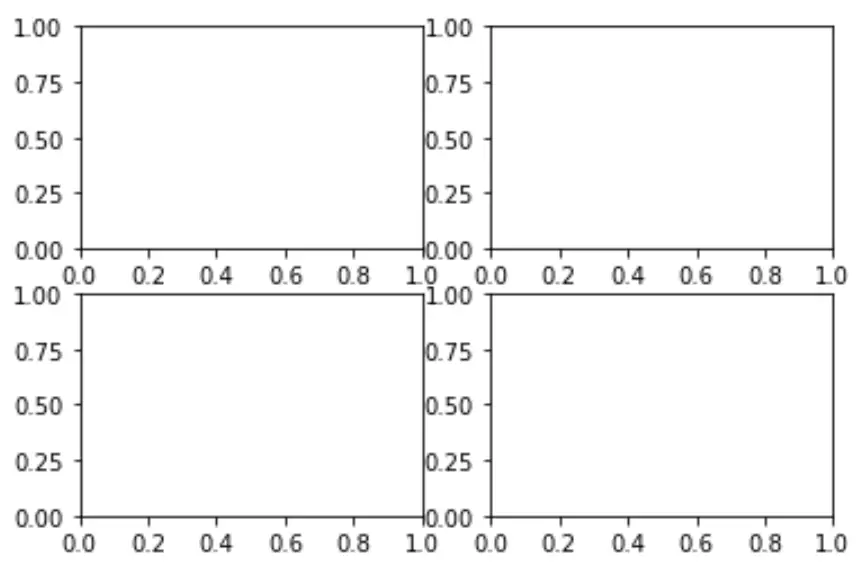
ध्यान दें कि कैसे सबप्लॉट थोड़ा ओवरलैप करते हैं।
Tight_layout() का उपयोग करके सबप्लॉट रिक्ति को समायोजित करें
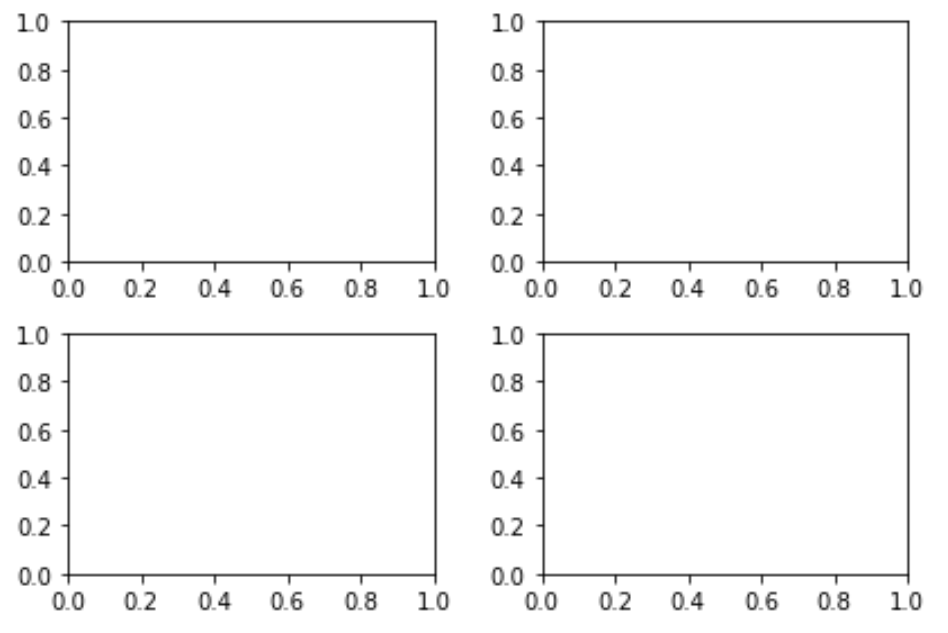
इस ओवरलैपिंग समस्या को हल करने का सबसे आसान तरीका Matplotlib Tight_layout() फ़ंक्शन का उपयोग करना है:
 import matplotlib.pyplot as plt

#define subplots
fig, ax = plt. subplots (2, 2)
fig. tight_layout ()

#display subplots
plt. show ()
सबप्लॉट शीर्षकों के अंतर को समायोजित करें
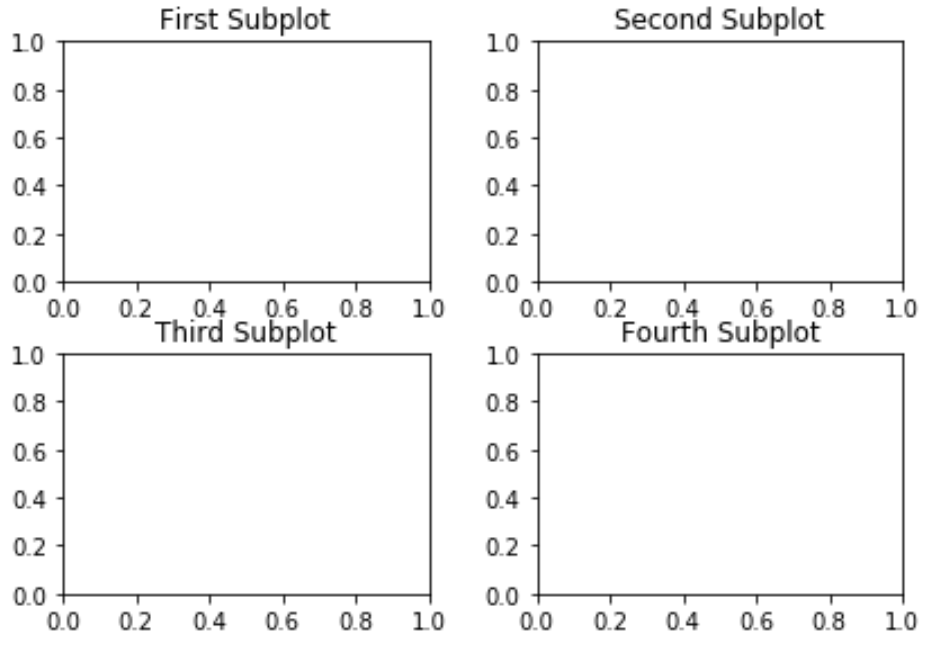
कुछ मामलों में, आप अपने प्रत्येक सबप्लॉट के लिए शीर्षक भी रख सकते हैं। दुर्भाग्य से, Tight_layout() फ़ंक्शन भी सबप्लॉट शीर्षकों को ओवरलैप करने का कारण बनता है:
 import matplotlib.pyplot as plt

#define subplots
fig, ax = plt. subplots (2, 2)
fig. tight_layout ()

#define subplot titles
ax[0, 0]. set_title ('First Subplot')
ax[0, 1]. set_title ('Second Subplot')
ax[1, 0]. set_title ('Third Subplot')
ax[1, 1]. set_title ('Fourth Subplot')

#display subplots
plt. show ()
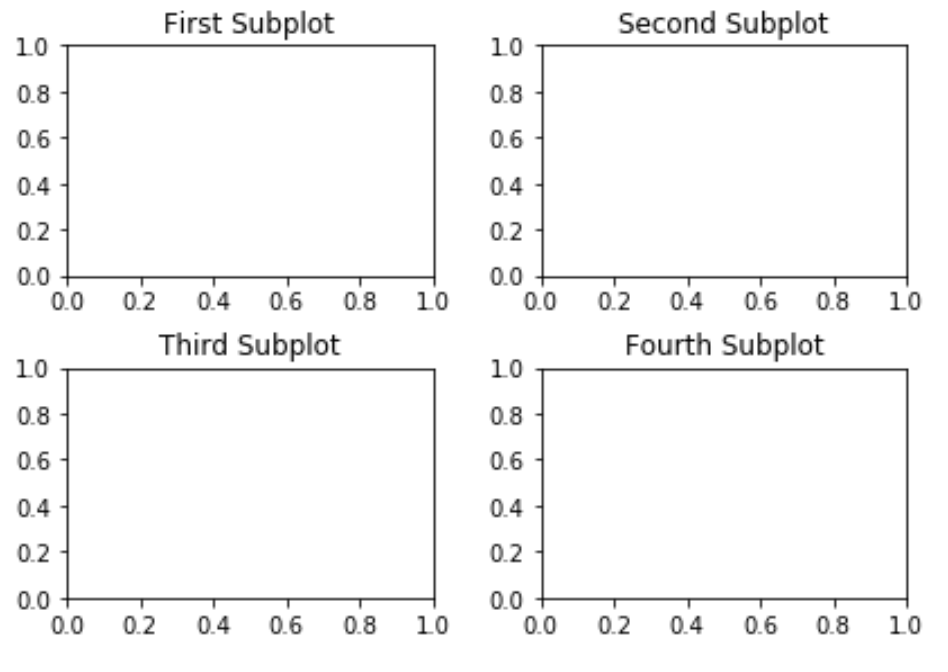
इसे ठीक करने का तरीका h_pad तर्क का उपयोग करके सबप्लॉट्स के बीच ऊंचाई पैडिंग को बढ़ाना है:
 import matplotlib.pyplot as plt

#define subplots
fig, ax = plt. subplots (2, 2)
fig. tight_layout (h_pad= 2 )

#define subplot titles
ax[0, 0]. set_title ('First Subplot')
ax[0, 1]. set_title ('Second Subplot')
ax[1, 0]. set_title ('Third Subplot')
ax[1, 1]. set_title ('Fourth Subplot')

#display subplots
plt. show ()
समग्र शीर्षक रिक्ति समायोजित करें
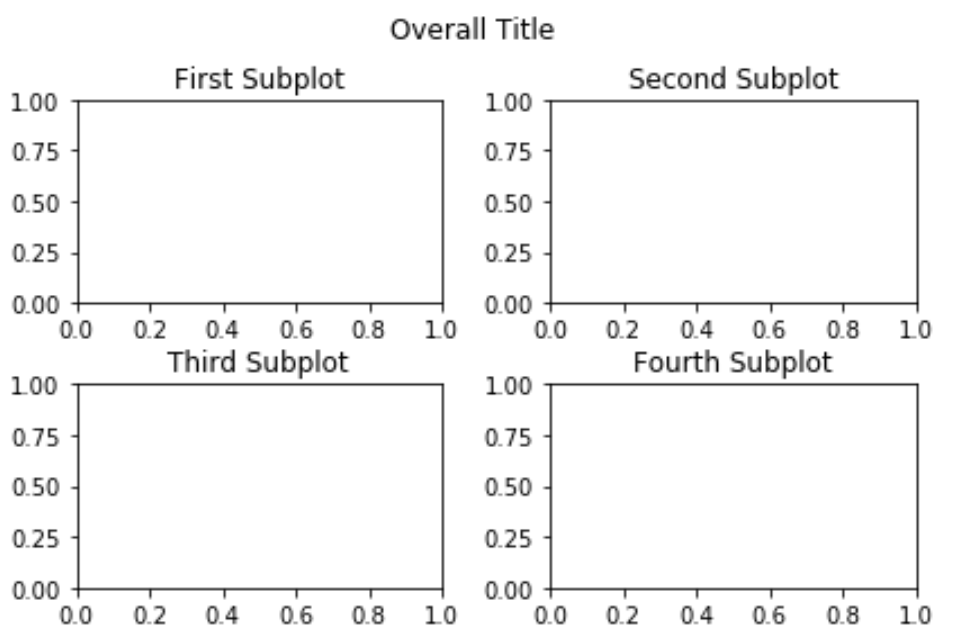
यदि आपके पास एक समग्र शीर्षक है, तो आप यह सुनिश्चित करने के लिए सबप्लॉट्स_एडजस्ट() फ़ंक्शन का उपयोग कर सकते हैं कि यह सबप्लॉट शीर्षकों के साथ ओवरलैप नहीं होता है:
 import matplotlib.pyplot as plt

#define subplots
fig, ax = plt. subplots (2, 2)
fig. tight_layout (h_pad= 2 )

#define subplot titles
ax[0, 0]. set_title ('First Subplot')
ax[0, 1]. set_title ('Second Subplot')
ax[1, 0]. set_title ('Third Subplot')
ax[1, 1]. set_title ('Fourth Subplot')

#add overall title and adjust it so that it doesn't overlap with subplot titles
fig.suptitle(' Overall Title ')
plt.subplots_adjust(top= 0.85 )

#display subplots
plt. show ()
आप यहां अधिक Matplotlib ट्यूटोरियल पा सकते हैं।
लेखक के बारे में
डॉ. बेंजामिन एंडरसन
नमस्ते, मैं बेंजामिन हूं, एक सेवानिवृत्त सांख्यिकी प्रोफेसर जो अब समर्पित Statorials शिक्षक बन गया है। सांख्यिकी के क्षेत्र में व्यापक अनुभव और विशेषज्ञता के साथ, मैं Statorials के माध्यम से छात्रों को सशक्त बनाने के लिए अपना ज्ञान साझा करने के लिए उत्सुक हूं। अधिक जाने