Ggplot2 में हिस्टोग्राम पर प्रतिशत कैसे प्रदर्शित करें
आप ggplot2 में हिस्टोग्राम के y-अक्ष पर प्रतिशत प्रदर्शित करने के लिए निम्नलिखित मूल वाक्यविन्यास का उपयोग कर सकते हैं:
 library (ggplot2)
library (scales)

#create histogram with percentages
ggplot(data, aes (x = factor (team))) +
  geom_bar( aes (y = (..count..)/ sum (..count..))) +
  scale_y_continuous(labels=percent)
निम्नलिखित उदाहरण दिखाते हैं कि व्यवहार में इस वाक्यविन्यास का उपयोग कैसे करें।
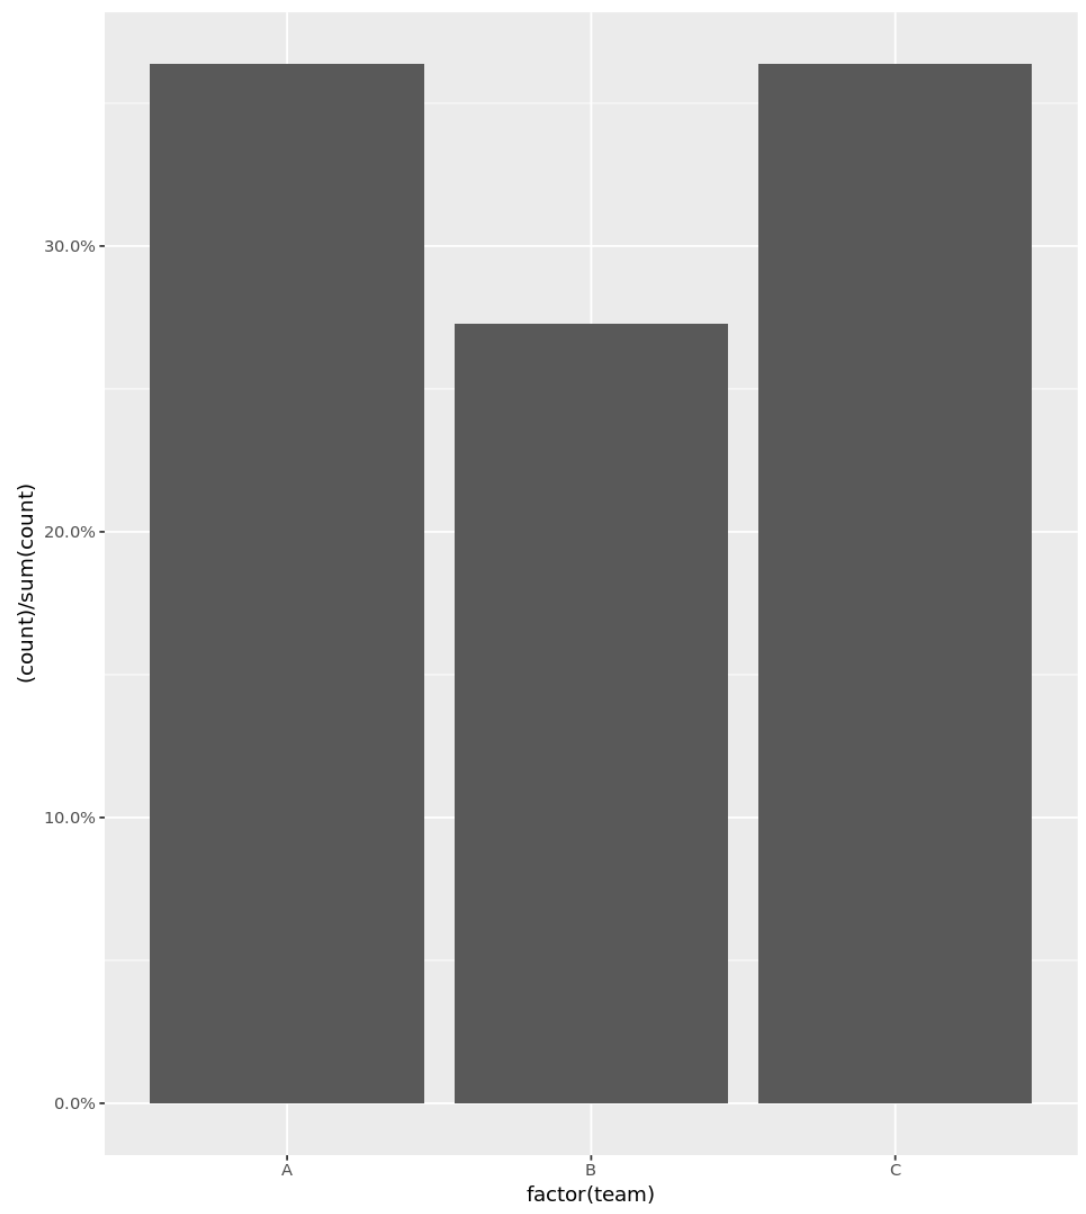
उदाहरण 1: प्रतिशत के साथ मूल हिस्टोग्राम
निम्नलिखित कोड दिखाता है कि वाई अक्ष पर प्रदर्शित प्रतिशत के साथ श्रेणीबद्ध चर के लिए हिस्टोग्राम कैसे बनाया जाए:
 library (ggplot2)
library (scales)

#define data frame
data <- data. frame (team = c('A', 'A', 'A', 'A', 'B', 'B', 'B', 'C', 'C', 'C', 'C') ,
                   points = c(77, 79, 93, 85, 89, 99, 90, 80, 68, 91, 92))

#create histogram with percentages
ggplot(data, aes (x = factor (team))) +
  geom_bar( aes (y = (..count..)/ sum (..count..))) +
  scale_y_continuous(labels=percent)
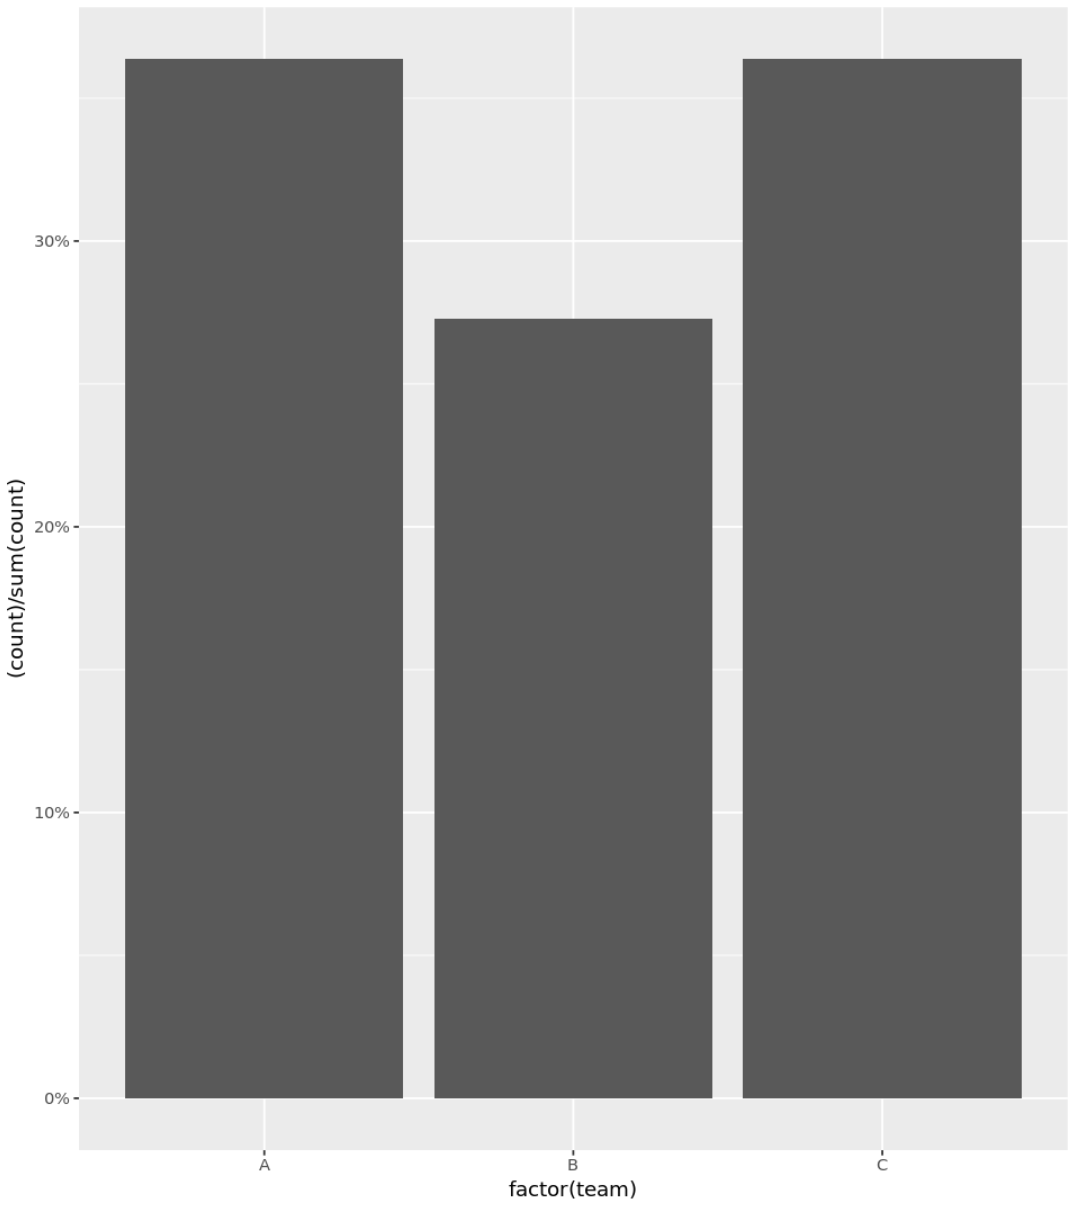
उदाहरण 2: प्रतिशत के साथ हिस्टोग्राम (दशमलव हटाएँ)
आप y-अक्ष पर केवल पूर्णांकों को प्रतिशत के रूप में प्रदर्शित करने के लिए सटीक तर्क का भी उपयोग कर सकते हैं:
 library (ggplot2)
library (scales)

#define data frame
data <- data. frame (team = c('A', 'A', 'A', 'A', 'B', 'B', 'B', 'C', 'C', 'C', 'C') ,
                   points = c(77, 79, 93, 85, 89, 99, 90, 80, 68, 91, 92))

#create histogram with percentages
ggplot(data, aes (x = factor (team))) +
  geom_bar( aes (y = (..count..)/ sum (..count..))) +
  scale_y_continuous(labels = scales :: percent_format(accuracy = 1L ))
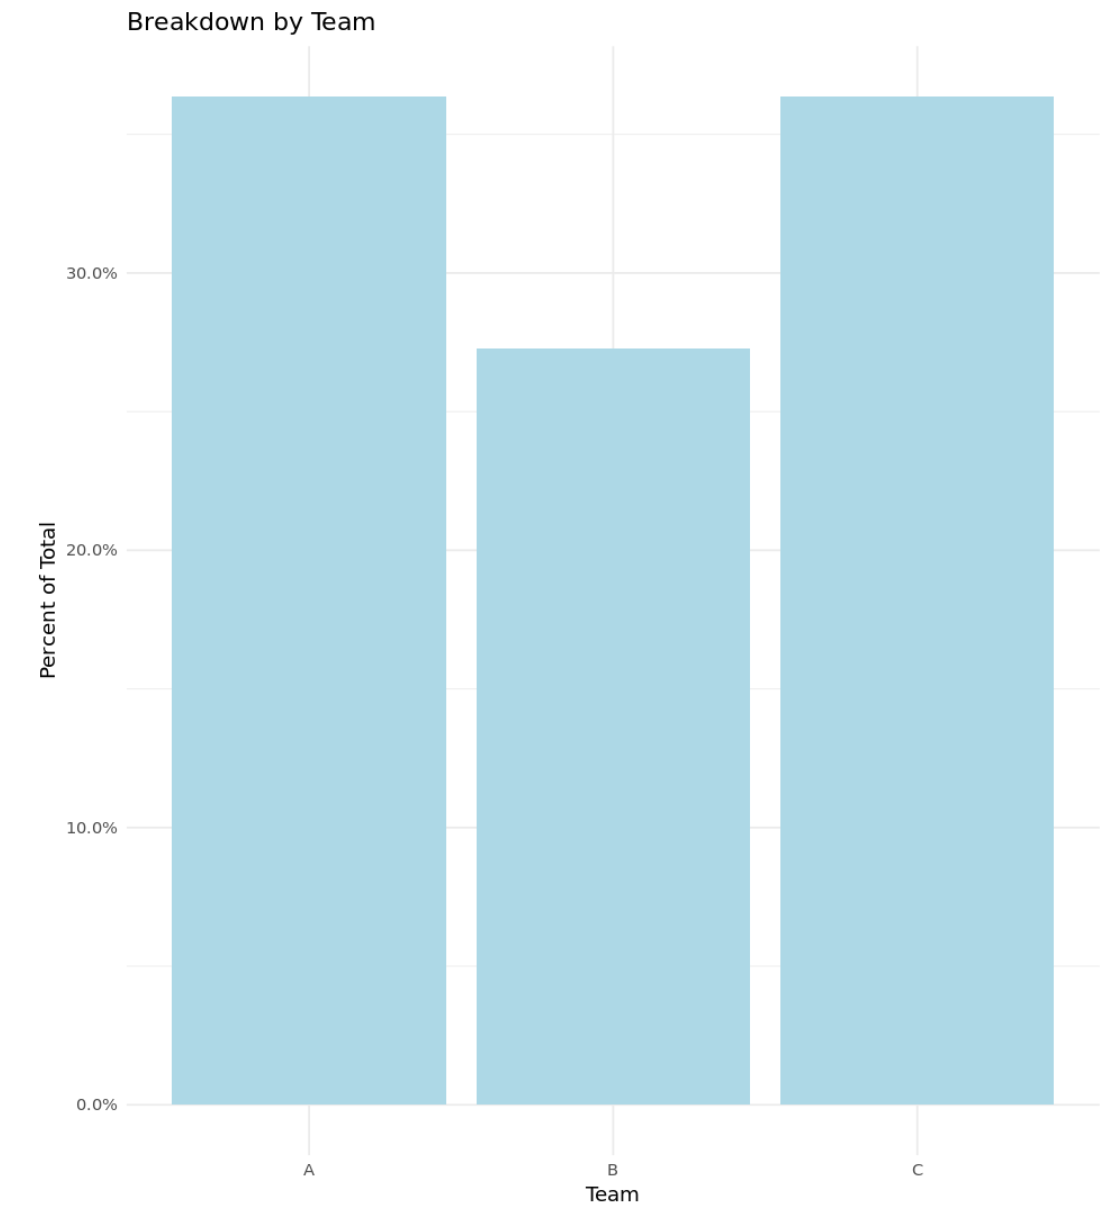
उदाहरण 3: प्रतिशत के साथ कस्टम हिस्टोग्राम
निम्नलिखित कोड दिखाता है कि Y अक्ष पर प्रदर्शित प्रतिशत और एक कस्टम शीर्षक, अक्ष लेबल और रंगों के साथ एक हिस्टोग्राम कैसे बनाया जाए:
 library (ggplot2)
library (scales)

#define data frame
data <- data. frame (team = c('A', 'A', 'A', 'A', 'B', 'B', 'B', 'C', 'C', 'C', 'C') ,
                   points = c(77, 79, 93, 85, 89, 99, 90, 80, 68, 91, 92))

#create histogram with percentages and custom aesthetics
ggplot(data, aes (x = factor (team))) +
  geom_bar( aes (y = (..count..)/ sum (..count..)), fill = ' lightblue ') +
  scale_y_continuous(labels=percent) +
  labs(title = ' Breakdown by Team ', x = ' Team ', y = ' Percent of Total ') +
  theme_minimal()
संबंधित: सर्वश्रेष्ठ ggplot2 थीम्स के लिए एक संपूर्ण मार्गदर्शिका
अतिरिक्त संसाधन
निम्नलिखित ट्यूटोरियल बताते हैं कि आर में हिस्टोग्राम के साथ अन्य सामान्य ऑपरेशन कैसे करें:
आर में हिस्टोग्राम में डिब्बे की संख्या कैसे बदलें
आर में एकाधिक हिस्टोग्राम कैसे प्लॉट करें
आर में सापेक्ष आवृत्ति हिस्टोग्राम कैसे बनाएं
लेखक के बारे में
डॉ. बेंजामिन एंडरसन
नमस्ते, मैं बेंजामिन हूं, एक सेवानिवृत्त सांख्यिकी प्रोफेसर जो अब समर्पित Statorials शिक्षक बन गया है। सांख्यिकी के क्षेत्र में व्यापक अनुभव और विशेषज्ञता के साथ, मैं Statorials के माध्यम से छात्रों को सशक्त बनाने के लिए अपना ज्ञान साझा करने के लिए उत्सुक हूं। अधिक जाने