Ggplot2 में लीजेंड का आकार कैसे बदलें (उदाहरण के साथ)
आप ggplot2 लेजेंड में तत्वों का आकार बदलने के लिए निम्नलिखित सिंटैक्स का उपयोग कर सकते हैं:
 ggplot(data, aes (x=x, y=y)) +
  theme( legend.key.size = unit(1, ' cm '), #change legend key size
legend.key.height = unit(1, ' cm '), #change legend key height
        legend.key.width = unit(1, ' cm '), #change legend key width
legend.title = element_text(size=14), #change legend title font size
        legend.text = element_text(size=10)) #change legend text font size
निम्नलिखित उदाहरण दिखाते हैं कि व्यवहार में इन तर्कों का उपयोग कैसे किया जाए।
Ggplot2 लेजेंड कुंजी का आकार बदलें
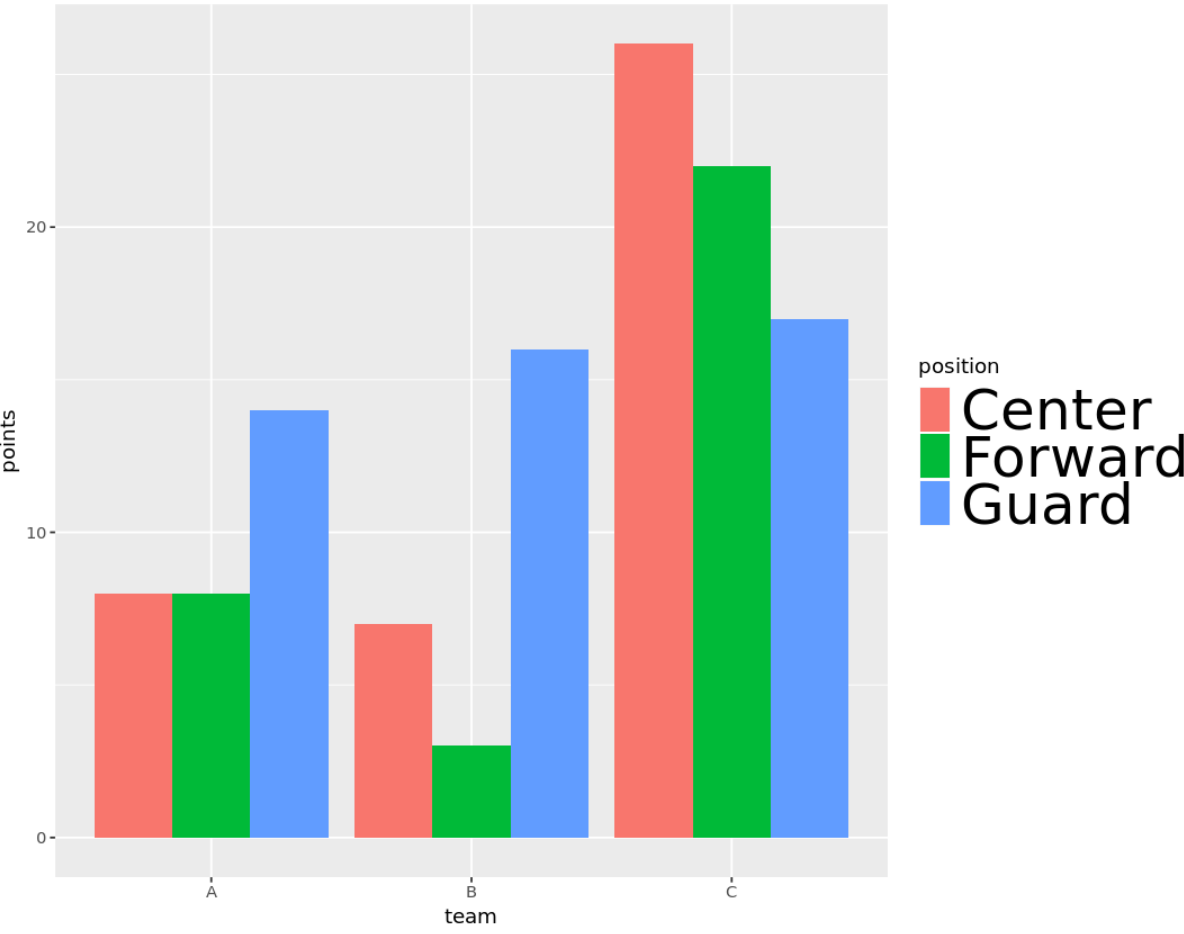
मान लीजिए कि हम ggplot2 का उपयोग करके निम्नलिखित समूहीकृत बारप्लॉट बनाते हैं:
 library (ggplot2)

#create data frame
df <- data.frame(team=rep(c(' A ', ' B ', ' C '), each =3),
                 position=rep(c(' Guard ', ' Forward ', ' Center '), times =3),
                 dots=c(14, 8, 8, 16, 3, 7, 17, 22, 26))

#create grouped barplot
ggplot(df, aes (fill=position, y=points, x=team)) +
  geom_bar(position=' dodge ', stat=' identity ')
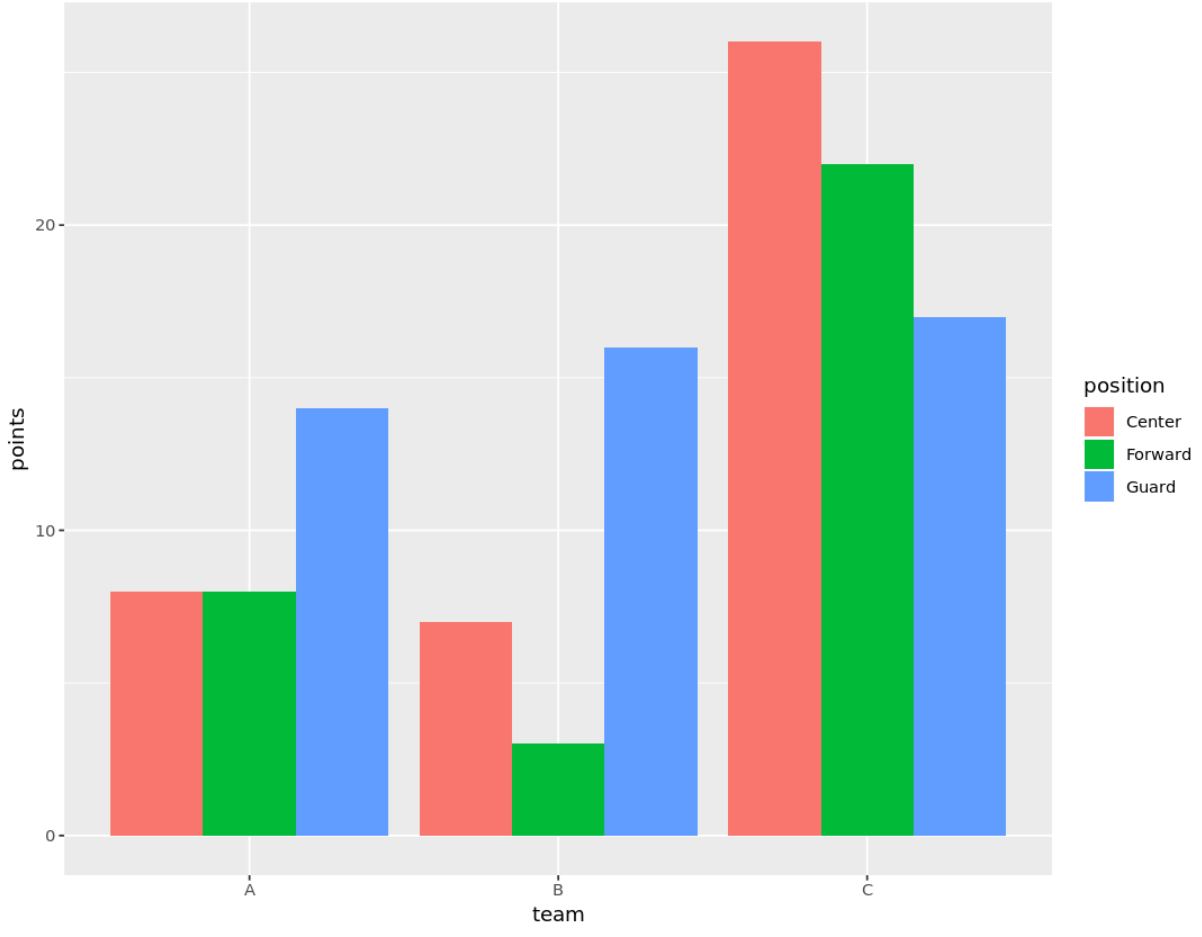
डिफ़ॉल्ट रूप से, ggplot2 ग्राफ़ के दाईं ओर एक लेजेंड प्रदान करता है।
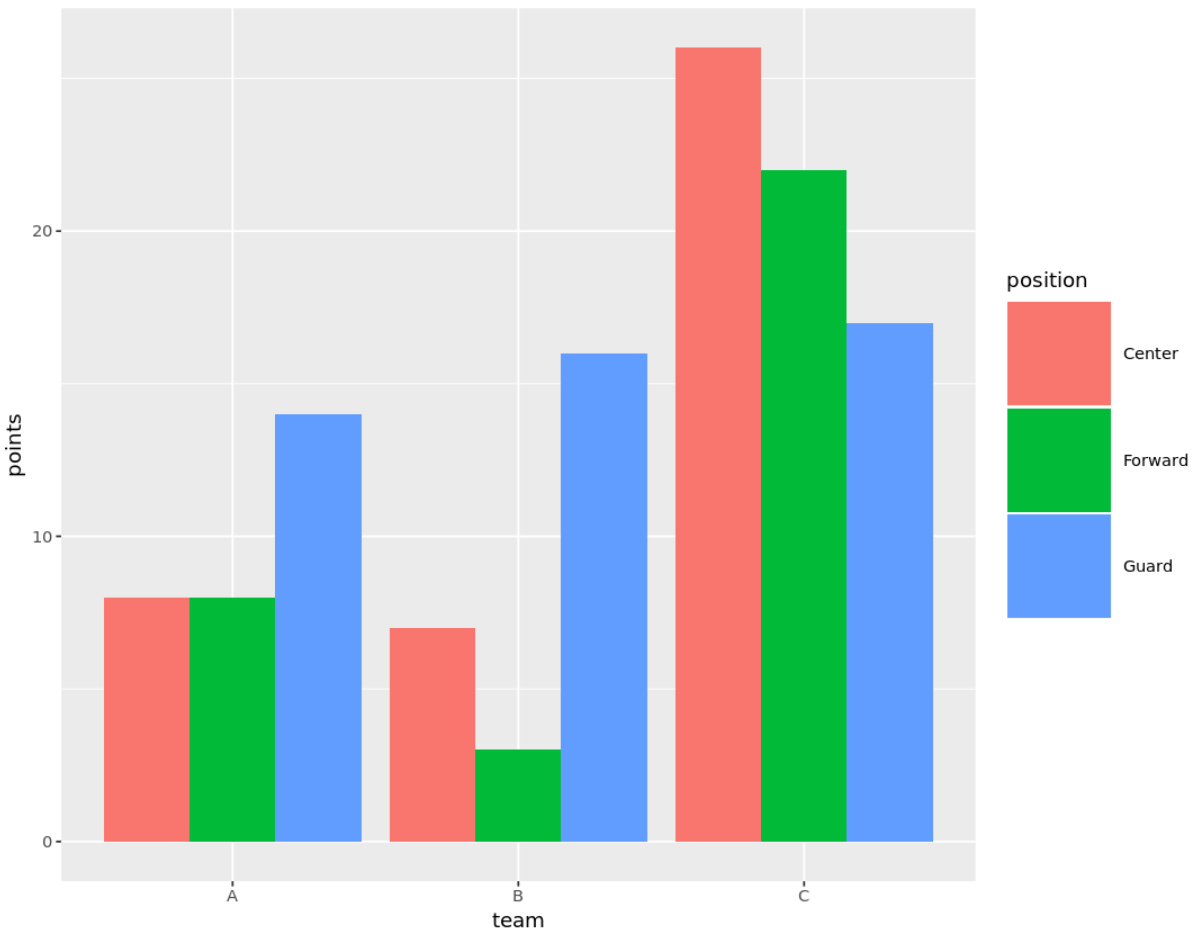
निम्नलिखित कोड दिखाता है कि लीजेंड कुंजियों को बड़ा करने के लिए Legend.key.size तर्क का उपयोग कैसे करें:
 ggplot(df, aes (fill=position, y=points, x=team)) +
  geom_bar(position=' dodge ', stat=' identity ') +
  theme( legend.key.size = unit(2, ' cm '))
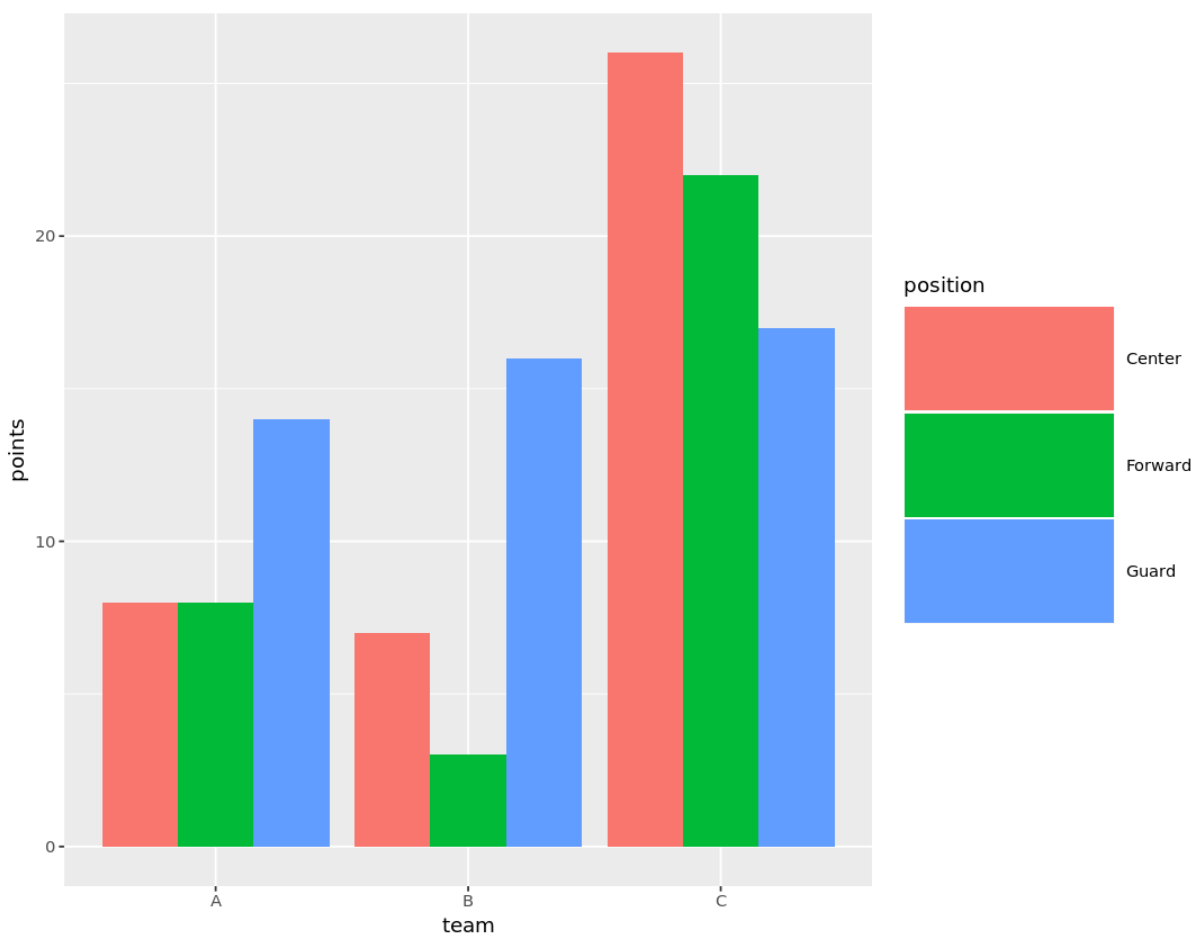
हम मुख्य चौड़ाई और ऊँचाई निर्दिष्ट करने के लिए Legend.key.width और Legend.key.height तर्कों का भी उपयोग कर सकते हैं:
 ggplot(df, aes (fill=position, y=points, x=team)) +
  geom_bar(position=' dodge ', stat=' identity ') +
  theme( legend.key.height = unit(2, ' cm '),
        legend.key.width = unit(4, ' cm '))
लेजेंड शीर्षक फ़ॉन्ट आकार ggplot2 बदलें
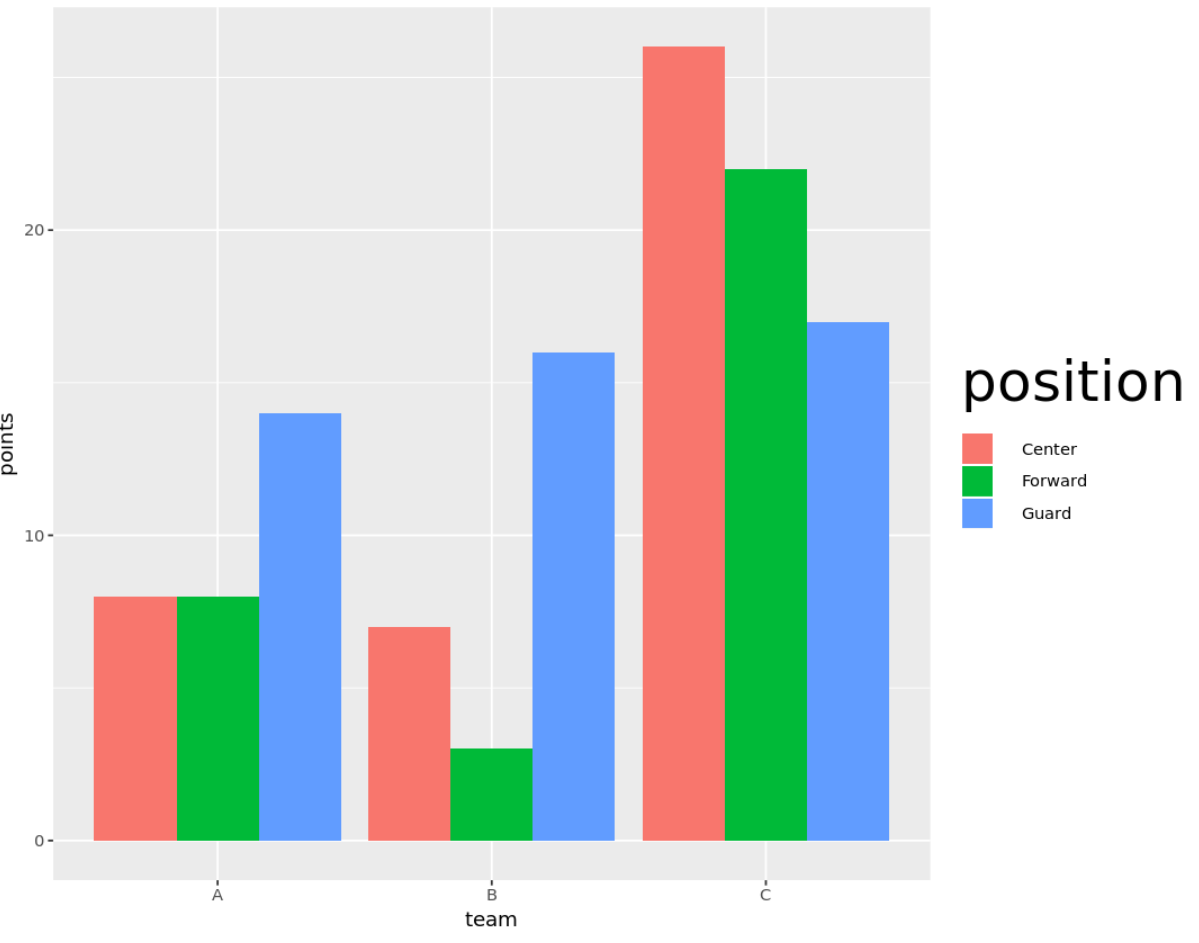
हम लेजेंड शीर्षक के फ़ॉन्ट आकार को बड़ा करने के लिए Legend.title तर्क का उपयोग कर सकते हैं:
 ggplot(df, aes (fill=position, y=points, x=team)) +
  geom_bar(position=' dodge ', stat=' identity ') +
  theme( legend.title = element_text(size=30))
लेजेंड टेक्स्ट फ़ॉन्ट आकार ggplot2 बदलें
हम लेजेंड शीर्षक के फ़ॉन्ट आकार को बड़ा करने के लिए Legend.text तर्क का उपयोग कर सकते हैं:
 ggplot(df, aes (fill=position, y=points, x=team)) +
  geom_bar(position=' dodge ', stat=' identity ') +
  theme( legend.text = element_text(size=30))
अतिरिक्त संसाधन
Ggplot2 में लेजेंड शीर्षक कैसे बदलें
Ggplot2 में लेजेंड स्थिति कैसे बदलें
Ggplot2 में एक लीजेंड को कैसे हटाएं
लेखक के बारे में
डॉ. बेंजामिन एंडरसन
नमस्ते, मैं बेंजामिन हूं, एक सेवानिवृत्त सांख्यिकी प्रोफेसर जो अब समर्पित Statorials शिक्षक बन गया है। सांख्यिकी के क्षेत्र में व्यापक अनुभव और विशेषज्ञता के साथ, मैं Statorials के माध्यम से छात्रों को सशक्त बनाने के लिए अपना ज्ञान साझा करने के लिए उत्सुक हूं। अधिक जाने