Ggplot2 में hjust का उपयोग कैसे करें और तत्वों को कैसे स्थानांतरित करें
आप ggplot2 में तत्वों को क्रमशः क्षैतिज और लंबवत रूप से स्थानांतरित करने के लिए hjust और vjust तर्कों का उपयोग कर सकते हैं।
निम्नलिखित उदाहरण दिखाते हैं कि विभिन्न परिदृश्यों में hjust और vjust का उपयोग कैसे करें।
उदाहरण 1: ggplot2 में शीर्षक स्थिति को स्थानांतरित करें
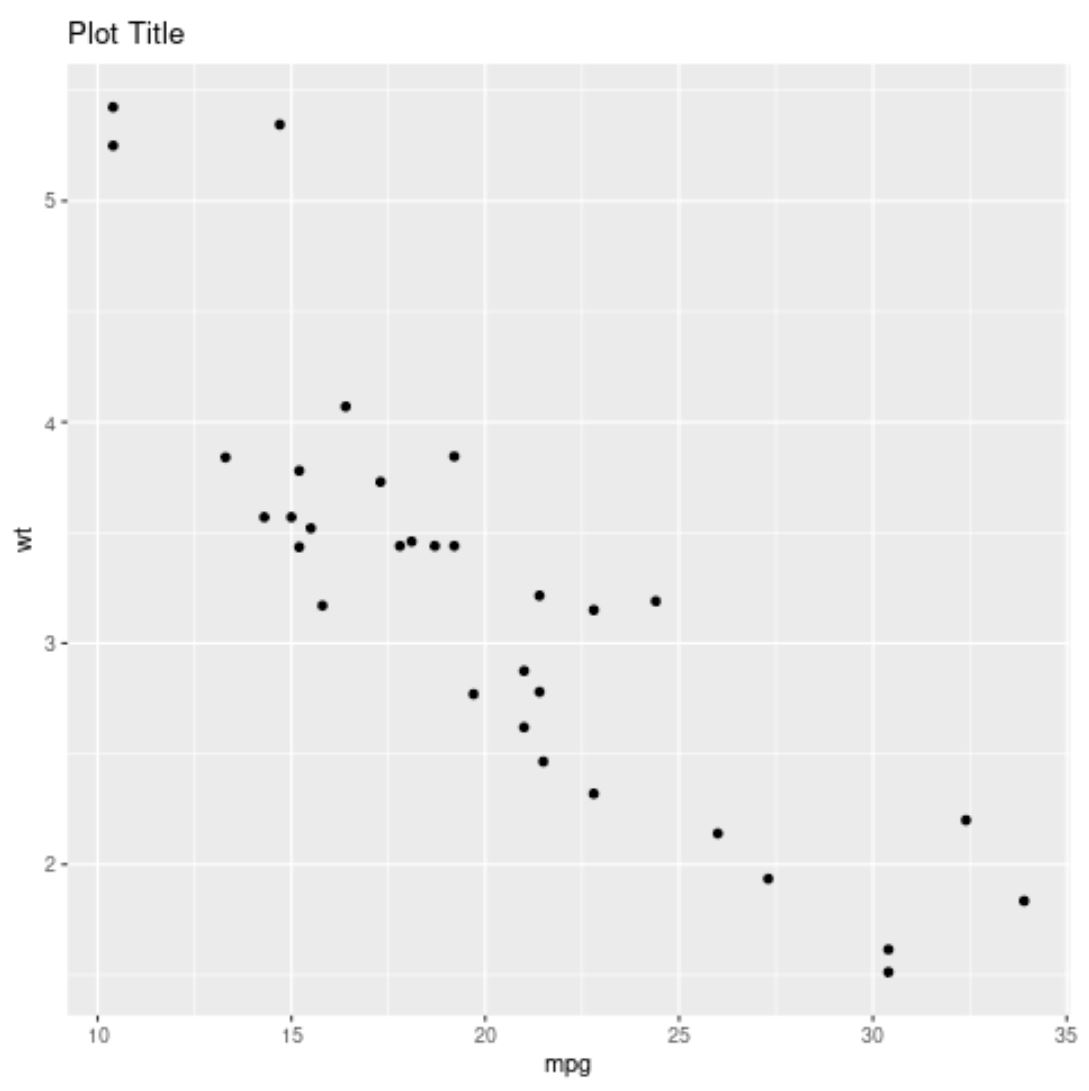
निम्नलिखित कोड दिखाता है कि डिफ़ॉल्ट स्थिति में शीर्षक के साथ ggplot2 में स्कैटरप्लॉट कैसे बनाया जाए (बाएं संरेखित):
 library (ggplot2)

#create scatter plot with title in default position
ggplot(data=mtcars, aes(x=mpg, y=wt)) +
  geom_point() +
  ggtitle(" Plot Title ")
और निम्नलिखित कोड दिखाता है कि hjust=0.5 का उपयोग करके शीर्षक को कैसे केन्द्रित किया जाए:
 library (ggplot2)

#create scatter plot with title center-aligned
ggplot(data=mtcars, aes(x=mpg, y=wt)) +
  geom_point() +
  ggtitle(" Plot Title ") +
  theme(plot. title = element_text(hjust= .5 ))
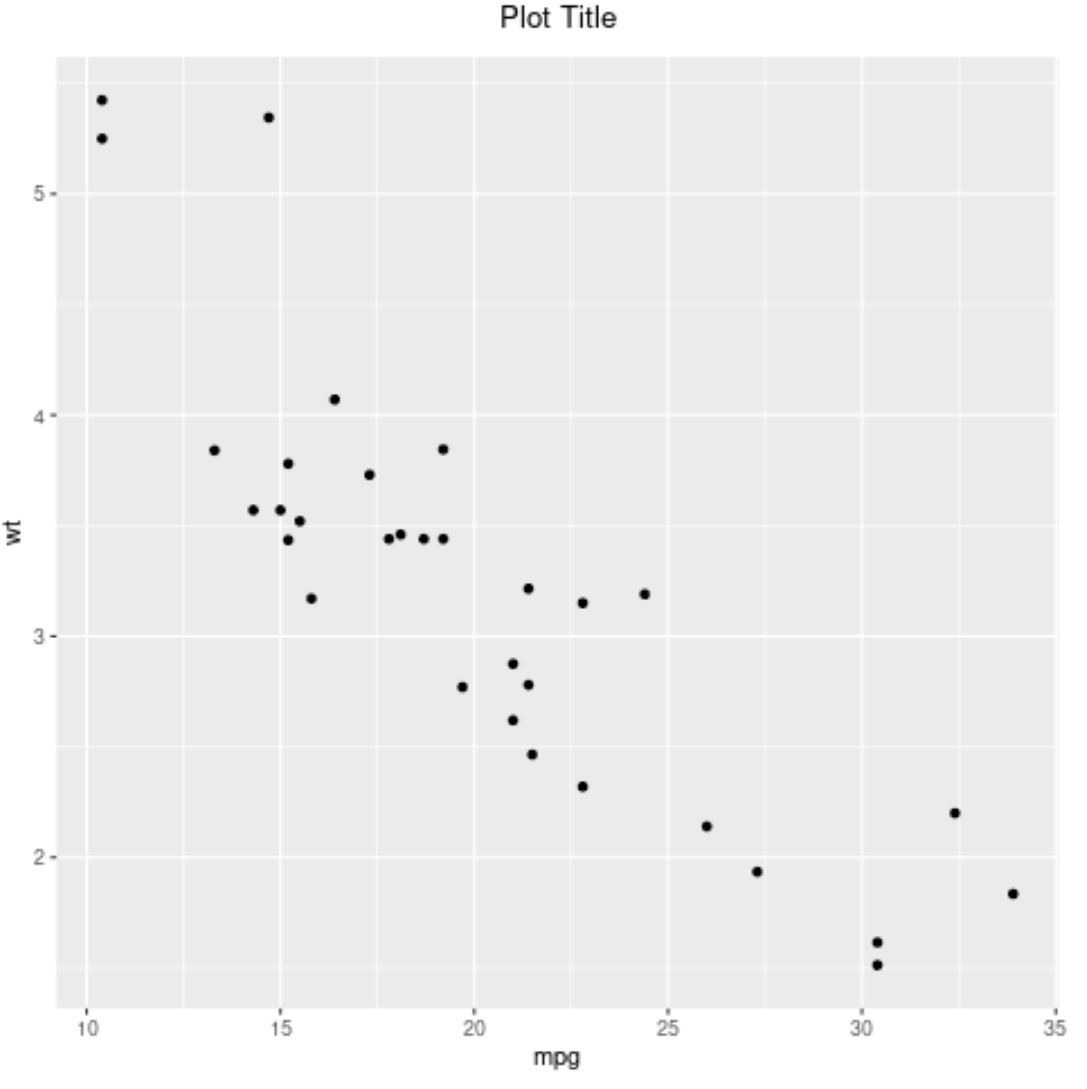
नोट : आप शीर्षक को सही संरेखित करने के लिए hjust=1 का भी उपयोग कर सकते हैं।
उदाहरण 2: ggplot2 में अक्ष लेबल स्थिति को स्थानांतरित करें
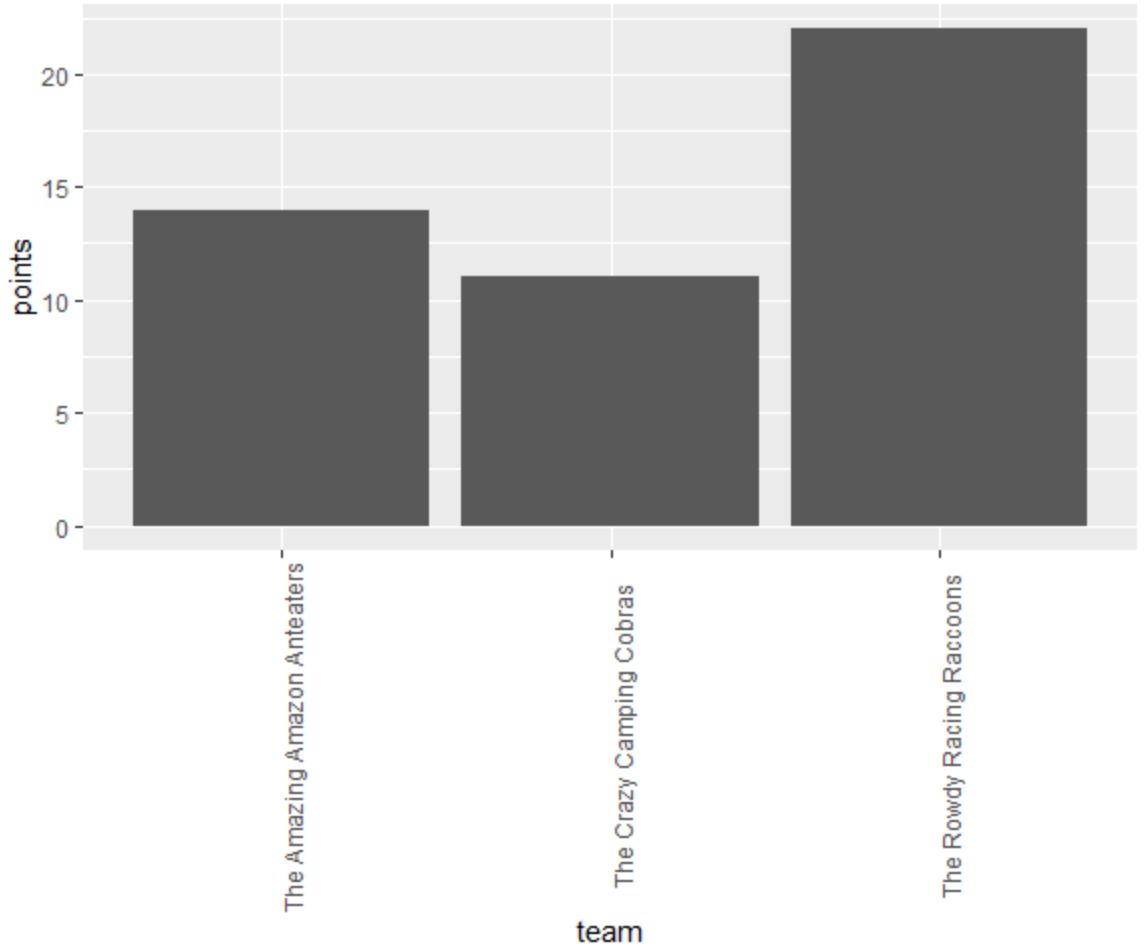
निम्नलिखित कोड दिखाता है कि ggplot2 में एक बार चार्ट कैसे बनाया जाए जिसमें x-अक्ष लेबल को पढ़ने में आसान बनाने के लिए 90 डिग्री घुमाया जाता है:
 library (ggplot2)

#create data frame
df = data. frame (team=c('The Amazing Amazon Anteaters',
                       'The Rowdy Racing Raccoons',
                       'The Crazy Camping Cobras'),
                dots=c(14, 22, 11))

#create bar plot to visualize points scored by each team
ggplot(data=df, aes(x=team, y=points)) +
  geom_bar(stat=' identity ') +
  theme(axis. text . x = element_text(angle= 90 ))
हम x-अक्ष लेबल को समायोजित करने के लिए hjust और vjust तर्कों का उपयोग कर सकते हैं ताकि वे x-अक्ष टिक चिह्नों के साथ अधिक निकटता से संरेखित हों:
 library (ggplot2)

#create data frame
df = data. frame (team=c('The Amazing Amazon Anteaters',
                       'The Rowdy Racing Raccoons',
                       'The Crazy Camping Cobras'),
                dots=c(14, 22, 11))

#create bar plot to visualize points scored by each team
ggplot(data=df, aes(x=team, y=points)) +
  geom_bar(stat=' identity ') +
  theme(axis. text . x = element_text(angle= 90 , vjust= .5 , hjust= 1 )

उदाहरण 3: ggplot2 में पाठ की स्थिति को स्थानांतरित करें
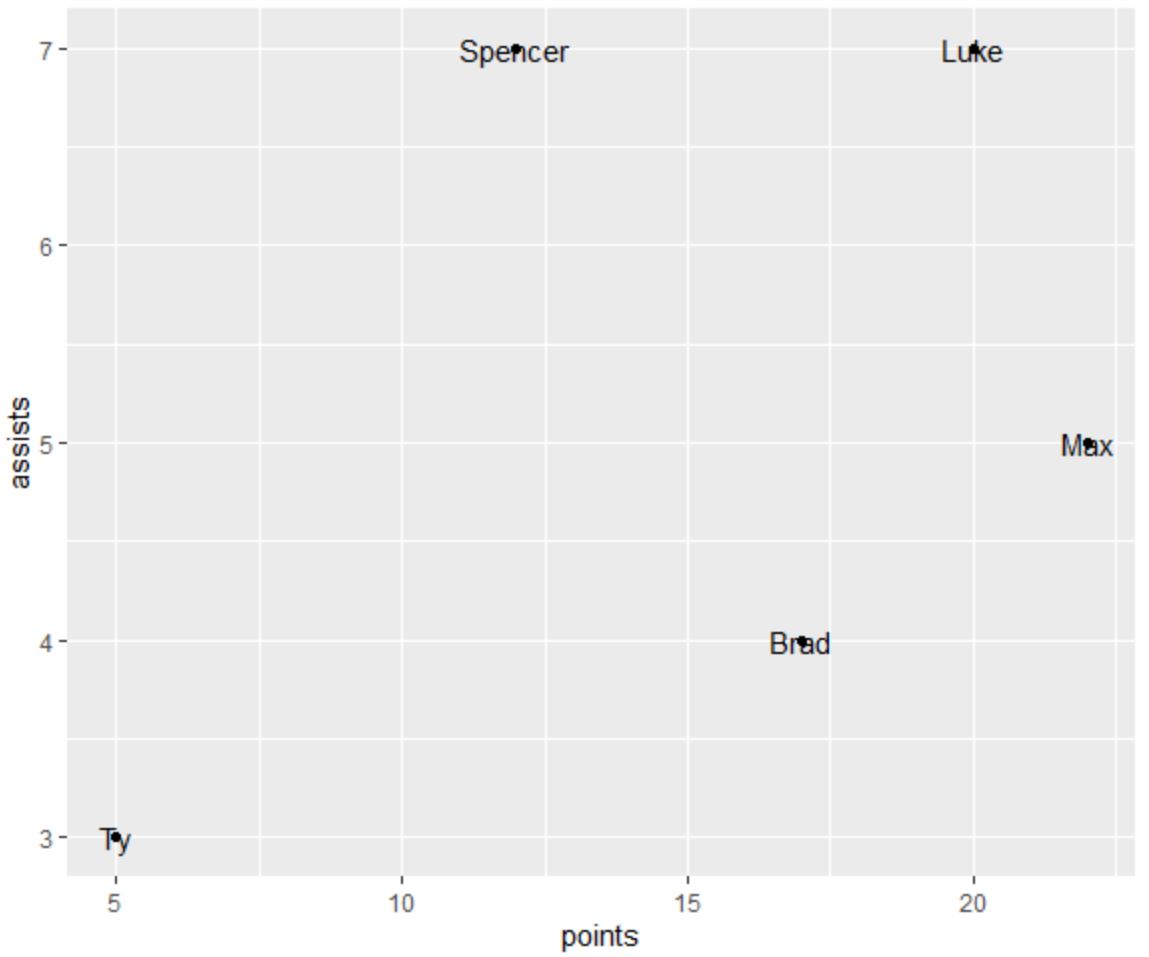
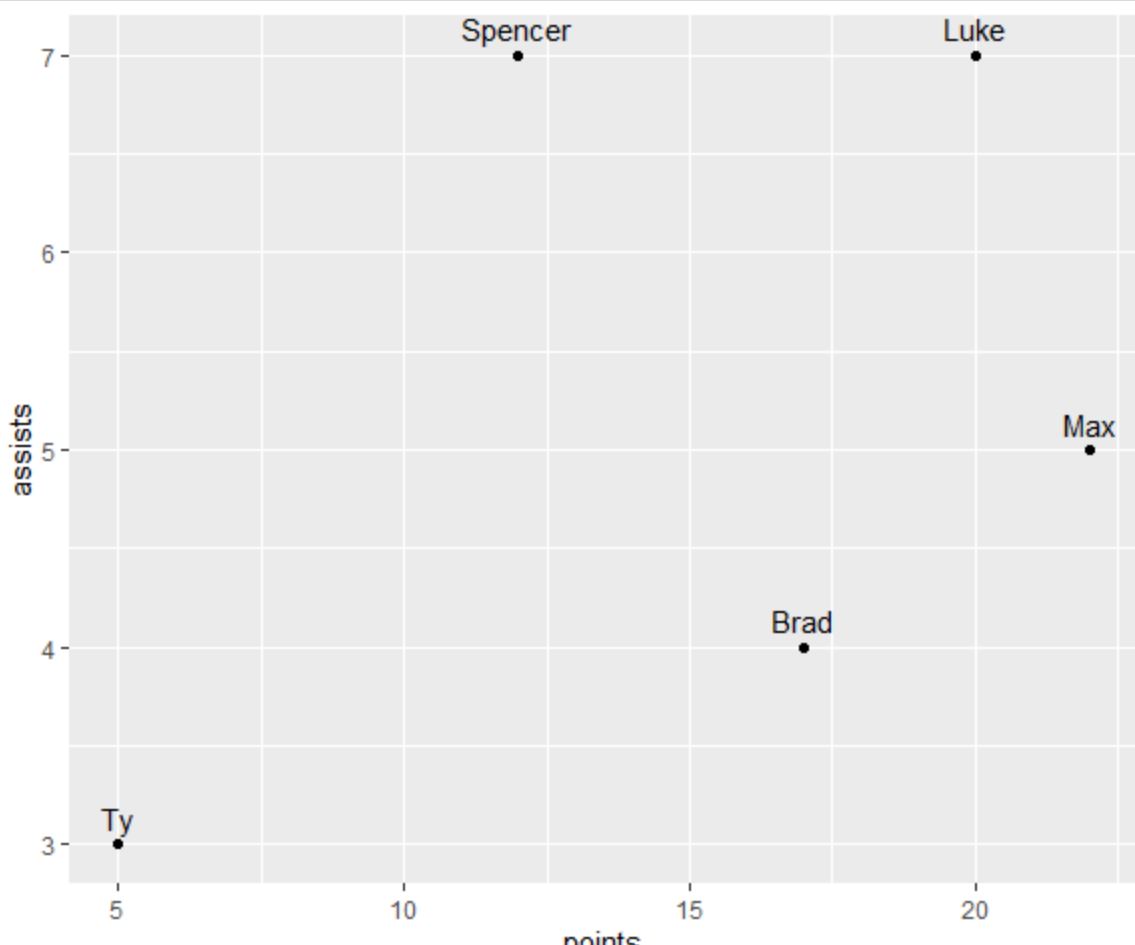
निम्नलिखित कोड दिखाता है कि प्लॉट के प्रत्येक बिंदु के लिए एनोटेटेड टेक्स्ट के साथ ggplot2 में स्कैटरप्लॉट कैसे बनाया जाए:
 library (ggplot2)

#create data frame
df <- data. frame (player=c('Brad', 'Ty', 'Spencer', 'Luke', 'Max'),
                 dots=c(17, 5, 12, 20, 22),
                 assists=c(4, 3, 7, 7, 5))

#create scatter plot with annotated labels
ggplot(df) +
  geom_point(aes(x=points, y=assists)) +
  geom_text(aes(x=points, y=assists, label=player))
हम टेक्स्ट तत्वों को लंबवत रूप से स्थानांतरित करने के लिए vjust तर्क का उपयोग कर सकते हैं ताकि उन्हें पढ़ना आसान हो:
 library (ggplot2)

#create data frame
df <- data. frame (player=c('Brad', 'Ty', 'Spencer', 'Luke', 'Max'),
                 dots=c(17, 5, 12, 20, 22),
                 assists=c(4, 3, 7, 7, 5))

#create scatter plot with annotated labels
ggplot(df) +
  geom_point(aes(x=points, y=assists)) +
  geom_text(aes(x=points, y=assists, label=player), vjust= -.6 )
हम टेक्स्ट तत्वों को लंबवत रूप से नीचे ले जाने के लिए vjust के लिए एक सकारात्मक मान का भी उपयोग कर सकते हैं:
 library (ggplot2)

#create data frame
df <- data. frame (player=c('Brad', 'Ty', 'Spencer', 'Luke', 'Max'),
                 dots=c(17, 5, 12, 20, 22),
                 assists=c(4, 3, 7, 7, 5))

#create scatter plot with annotated labels
ggplot(df) +
  geom_point(aes(x=points, y=assists)) +
  geom_text(aes(x=points, y=assists, label=player), vjust= 1.2 )
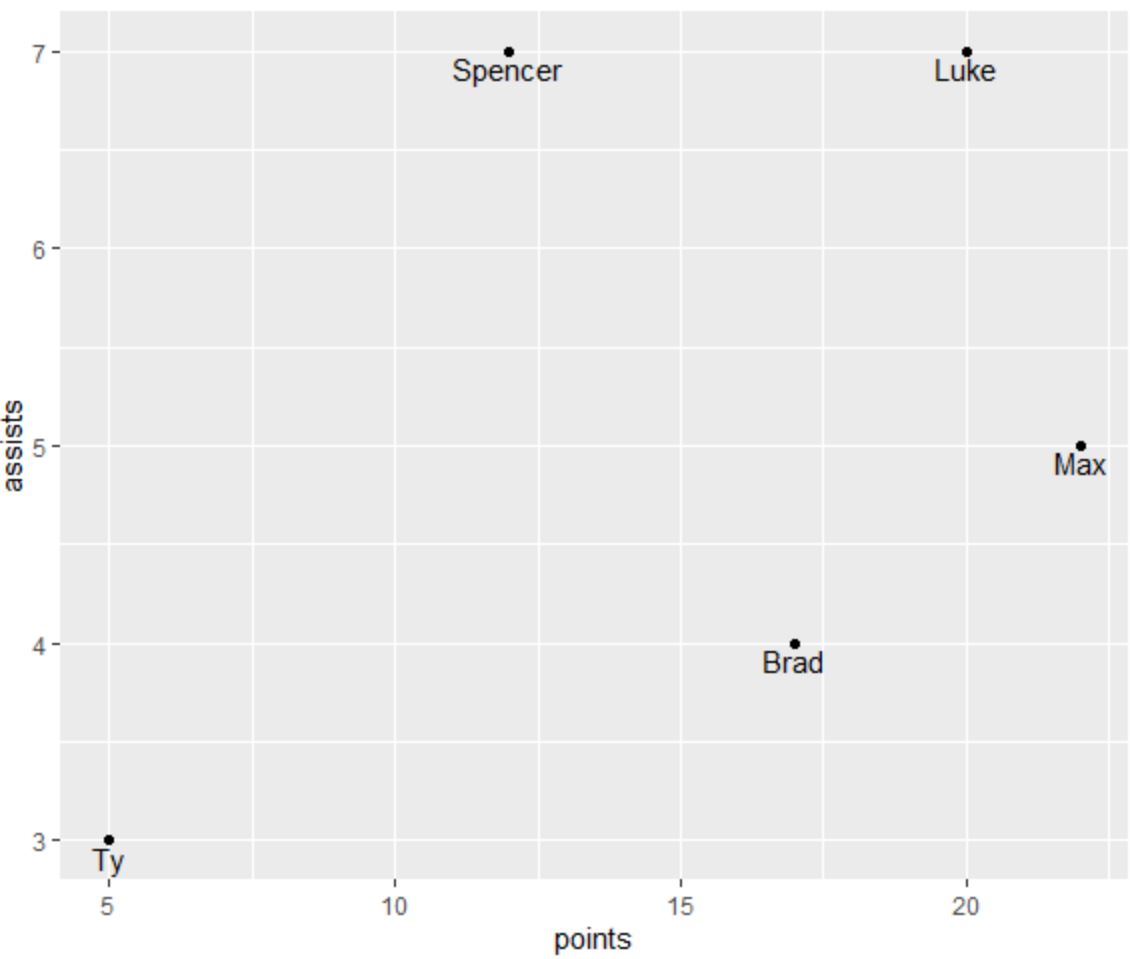
एनोटेट किया गया पाठ अब कथानक के प्रत्येक बिंदु के नीचे स्थित है।
अतिरिक्त संसाधन
निम्नलिखित ट्यूटोरियल बताते हैं कि ggplot2 में अन्य सामान्य कार्य कैसे करें:
Ggplot2 में लेजेंड शीर्षक कैसे बदलें
Ggplot2 में अक्ष लेबल को कैसे घुमाएँ
आर में कैसे ठीक करें: फ़ंक्शन “जीजीप्लॉट” नहीं मिल सका
लेखक के बारे में
डॉ. बेंजामिन एंडरसन
नमस्ते, मैं बेंजामिन हूं, एक सेवानिवृत्त सांख्यिकी प्रोफेसर जो अब समर्पित Statorials शिक्षक बन गया है। सांख्यिकी के क्षेत्र में व्यापक अनुभव और विशेषज्ञता के साथ, मैं Statorials के माध्यम से छात्रों को सशक्त बनाने के लिए अपना ज्ञान साझा करने के लिए उत्सुक हूं। अधिक जाने