Matplotlib के साथ तालिका कैसे बनाएं
आप Matplotlib का उपयोग करके पायथन में तालिकाएँ बनाने के लिए निम्नलिखित दो तरीकों में से किसी एक का उपयोग कर सकते हैं:
विधि 1: पांडा डेटाफ़्रेम से एक तालिका बनाएँ
 #create pandas DataFrame
df = pd.DataFrame(np. random . randn (20, 2), columns=[' First ', ' Second '])

#create table
table = ax. table (cellText=df. values , colLabels=df. columns , loc=' center ')
विधि 2: कस्टम मानों से एक सरणी बनाएं
 #create values for table
table_data=[
    ["Player 1", 30],
    ["Player 2", 20],
    ["Player 3", 33],
    ["Player 4", 25],
    ["Player 5", 12]
]

#create table
table = ax. table (cellText=table_data, loc=' center ')
यह ट्यूटोरियल व्यवहार में इन विधियों का उपयोग कैसे करें इसके उदाहरण प्रदान करता है।
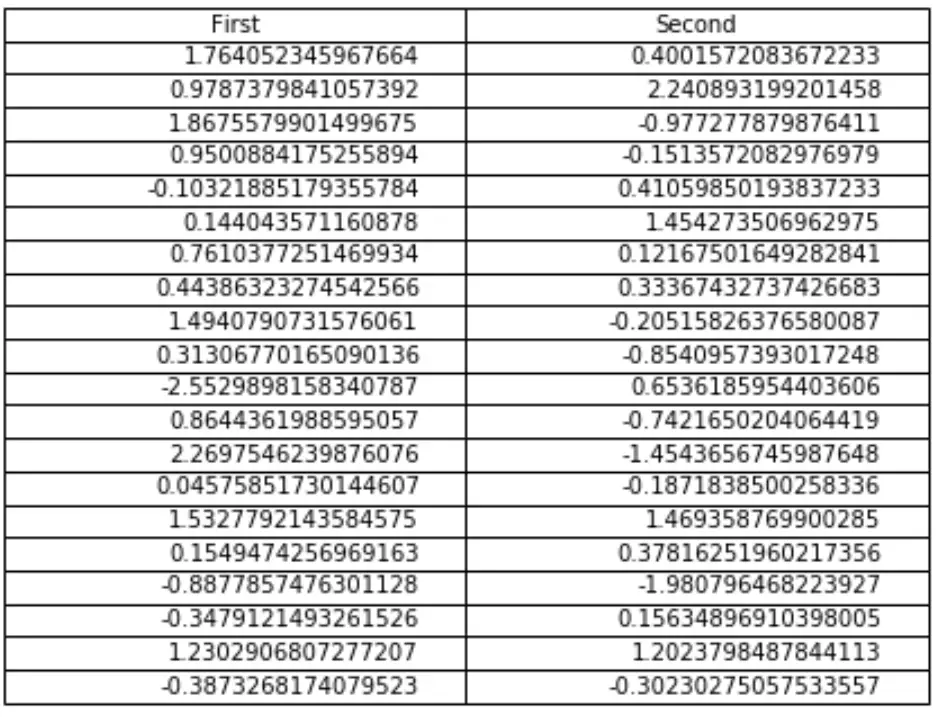
उदाहरण 1: पांडा डेटाफ़्रेम से एक तालिका बनाएं
निम्नलिखित कोड दिखाता है कि मैटप्लोटलिब में पांडा डेटाफ़्रेम के मानों वाली एक तालिका कैसे बनाई जाए:
 import numpy as np
import pandas as pd
import matplotlib.pyplot as plt

#make this example reproducible
n.p. random . seeds (0)

#define figure and axes
fig, ax = plt. subplots ()

#hide the axes
fig.patch. set_visible (False)
ax.axis(' off ')
ax.axis(' tight ')

#createdata
df = pd.DataFrame(np. random . randn (20, 2), columns=[' First ', ' Second '])

#create table
table = ax. table (cellText=df.values, colLabels=df.columns, loc=' center ')

#display table
fig. tight_layout ()
plt. show ()
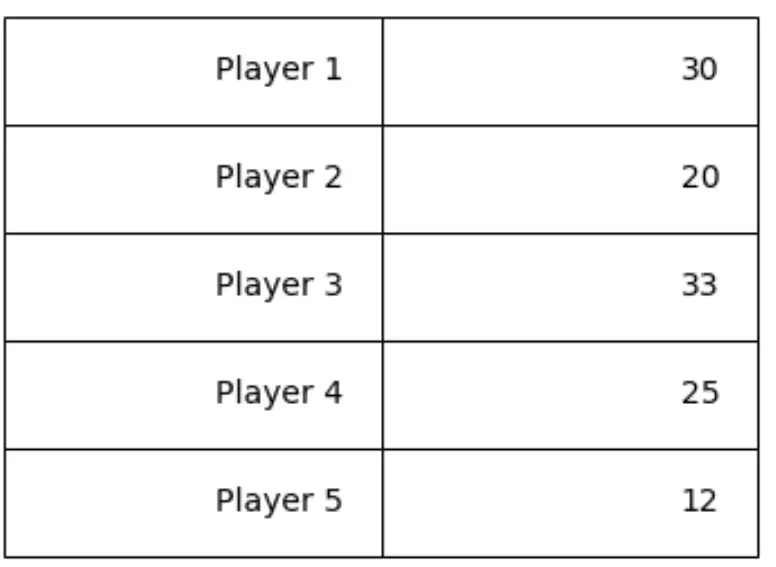
उदाहरण 2: कस्टम मानों से एक तालिका बनाएं
निम्नलिखित कोड दिखाता है कि Matplotlib में कस्टम मानों वाली एक तालिका कैसे बनाई जाए:
 import numpy as np
import pandas as pd
import matplotlib.pyplot as plt

#define figure and axes
fig, ax = plt. subplots ()

#create values for table
table_data=[
    ["Player 1", 30],
    ["Player 2", 20],
    ["Player 3", 33],
    ["Player 4", 25],
    ["Player 5", 12]
]

#create table
table = ax. table (cellText=table_data, loc=' center ')

#modify table
table. set_fontsize (14)
table. scale (1.4)
ax. axis (' off ')

#displaytable
plt. show ()
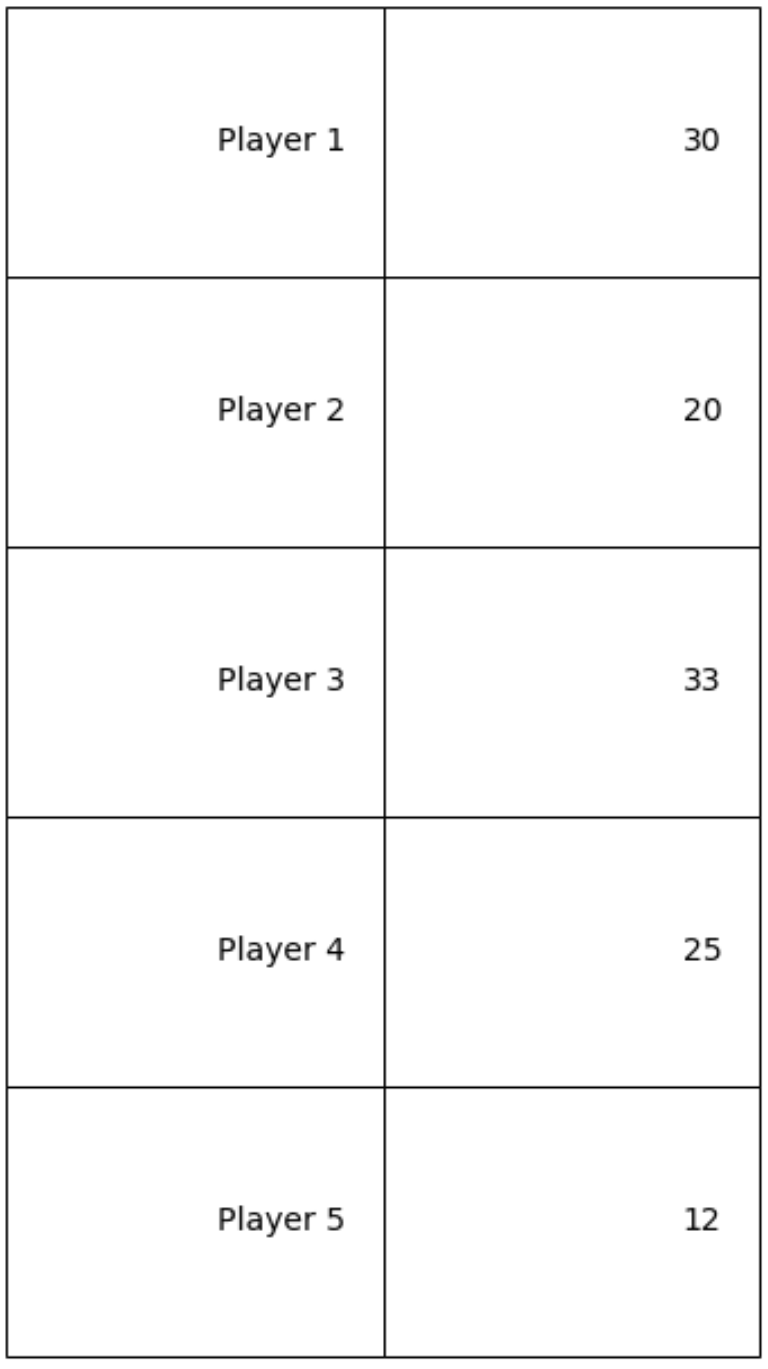
ध्यान दें कि Table.scale(width, length) तालिका की चौड़ाई और लंबाई को संशोधित करता है। उदाहरण के लिए, हम लंबाई बदलकर तालिका को और भी लंबा बना सकते हैं:
table. scale (1.10)
अतिरिक्त संसाधन
Matplotlib प्लॉट्स में टेक्स्ट कैसे जोड़ें
Matplotlib में पहलू अनुपात कैसे सेट करें
Matplotlib में लेजेंड फ़ॉन्ट आकार कैसे बदलें
लेखक के बारे में
डॉ. बेंजामिन एंडरसन
नमस्ते, मैं बेंजामिन हूं, एक सेवानिवृत्त सांख्यिकी प्रोफेसर जो अब समर्पित Statorials शिक्षक बन गया है। सांख्यिकी के क्षेत्र में व्यापक अनुभव और विशेषज्ञता के साथ, मैं Statorials के माध्यम से छात्रों को सशक्त बनाने के लिए अपना ज्ञान साझा करने के लिए उत्सुक हूं। अधिक जाने