मैटप्लोटलिब में अक्षों को कैसे छिपाएं (उदाहरण के साथ)
आप Matplotlib प्लॉट्स में अक्षों को छिपाने के लिए निम्नलिखित सिंटैक्स का उपयोग कर सकते हैं:
 import matplotlib. pyplot as plt

#get current axes
ax = plt. gca ()

#hide x-axis
ax. get_xaxis (). set_visible ( False )

#hide y-axis
ax. get_yaxis (). set_visible ( False )
निम्नलिखित उदाहरण दिखाते हैं कि व्यवहार में इस वाक्यविन्यास का उपयोग कैसे करें।
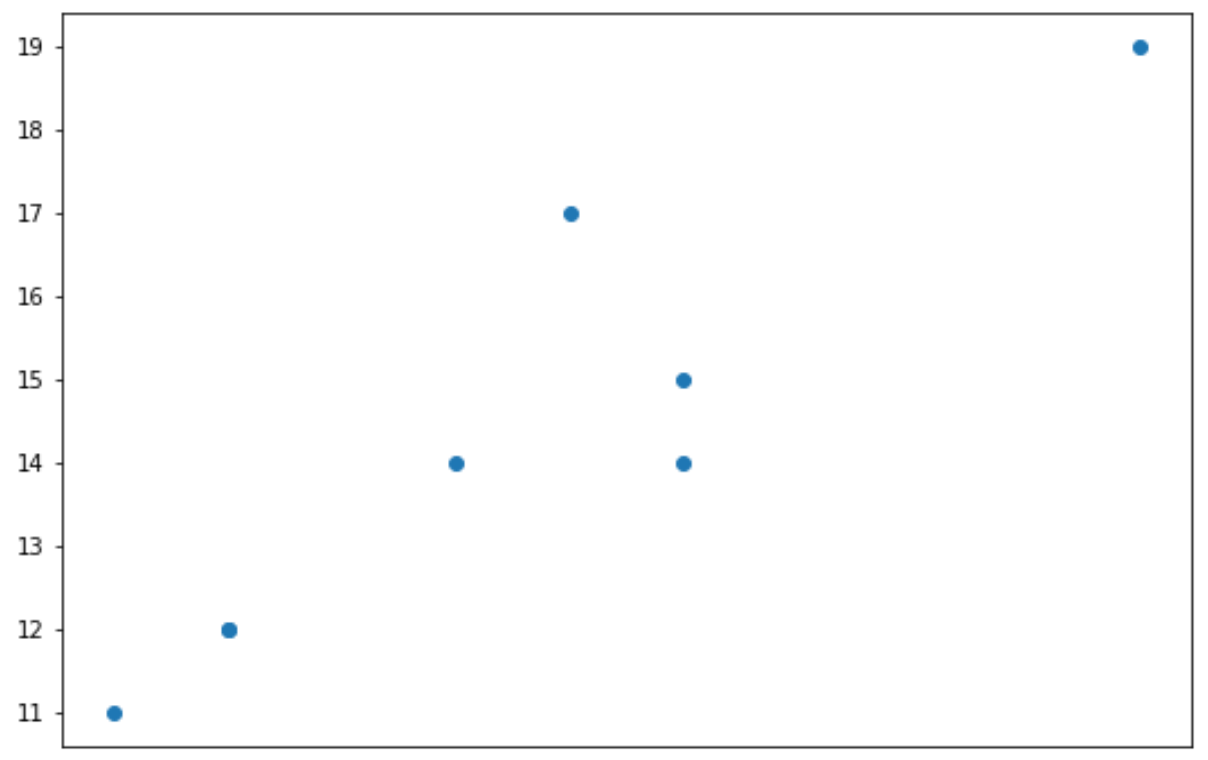
उदाहरण 1: एक्स अक्ष छिपाएँ
निम्नलिखित कोड दिखाता है कि स्कैटरप्लॉट कैसे बनाएं और एक्स-अक्ष को कैसे छिपाएं:
 import matplotlib. pyplot as plt

#define data
x = [3, 4, 4, 6, 7, 8, 8, 12]
y = [11, 12, 12, 14, 17, 15, 14, 19]

#create scatterplot
plt. scatter (x,y)

#get current axes
ax = plt. gca ()

#hide x-axis
ax. get_xaxis (). set_visible ( False )
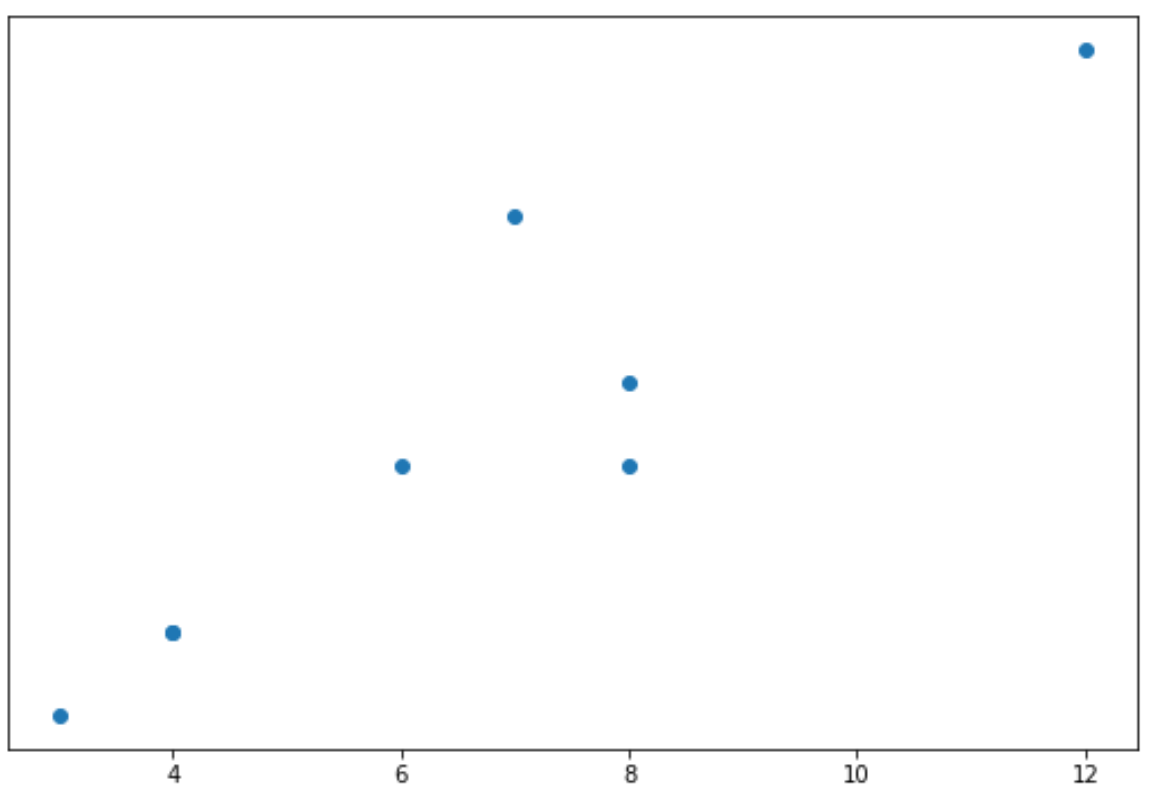
उदाहरण 2: Y अक्ष छिपाएँ
निम्नलिखित कोड दिखाता है कि स्कैटरप्लॉट कैसे बनाएं और Y अक्ष को कैसे छिपाएं:
 import matplotlib. pyplot as plt

#define data
x = [3, 4, 4, 6, 7, 8, 8, 12]
y = [11, 12, 12, 14, 17, 15, 14, 19]

#create scatterplot
plt. scatter (x,y)

#get current axes
ax = plt. gca ()

#hide y-axis
ax. get_yaxis (). set_visible ( False )
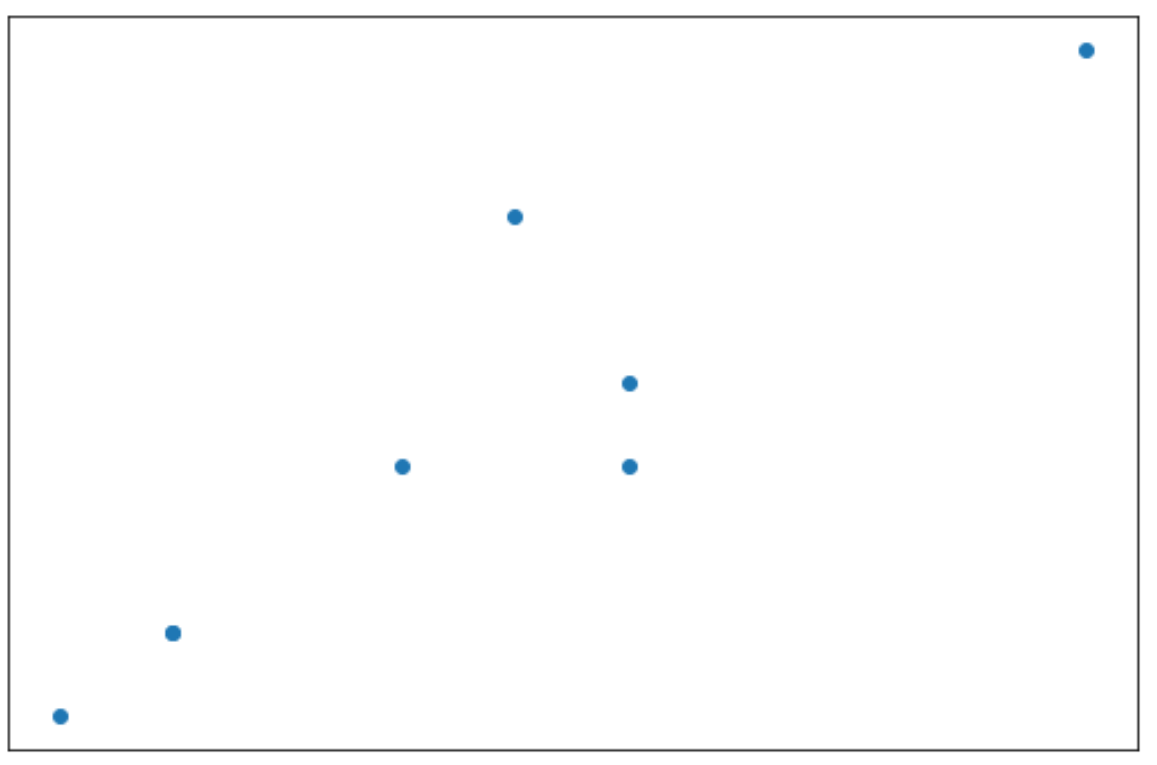
उदाहरण 3: दोनों अक्ष छिपाएँ
निम्नलिखित कोड दिखाता है कि स्कैटरप्लॉट और हाइड एक्सिस दोनों कैसे बनाएं:
 import matplotlib. pyplot as plt

#define data
x = [3, 4, 4, 6, 7, 8, 8, 12]
y = [11, 12, 12, 14, 17, 15, 14, 19]

#create scatterplot
plt. scatter (x,y)

#get current axes
ax = plt. gca ()

#hide x-axis
ax. get_xaxis (). set_visible ( False )

#hide y-axis
ax. get_yaxis (). set_visible ( False )
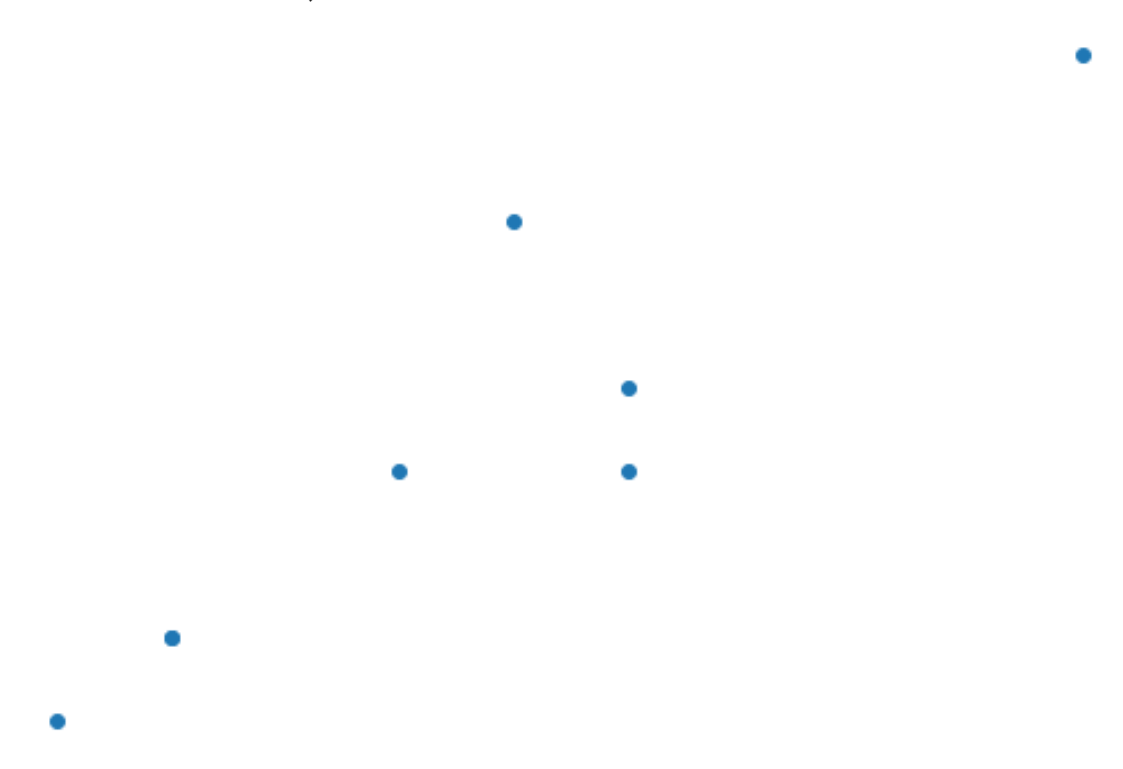
उदाहरण 4: अक्षों और सीमाओं को पूरी तरह से हटा दें
निम्नलिखित कोड दिखाता है कि प्लॉट से अक्षों और सीमाओं को पूरी तरह से कैसे हटाया जाए:
 import matplotlib. pyplot as plt

#define data
x = [3, 4, 4, 6, 7, 8, 8, 12]
y = [11, 12, 12, 14, 17, 15, 14, 19]

#create scatterplot
plt. scatter (x,y)

#get current axes
ax = plt. gca ()

#hide axes and borders
plt. axis (' off ')
अतिरिक्त संसाधन
Matplotlib में टिकों की संख्या कैसे बदलें
Matplotlib में चेकमार्क लेबल को कैसे घुमाएँ
Matplotlib में अक्ष श्रेणियाँ कैसे सेट करें
लेखक के बारे में
डॉ. बेंजामिन एंडरसन
नमस्ते, मैं बेंजामिन हूं, एक सेवानिवृत्त सांख्यिकी प्रोफेसर जो अब समर्पित Statorials शिक्षक बन गया है। सांख्यिकी के क्षेत्र में व्यापक अनुभव और विशेषज्ञता के साथ, मैं Statorials के माध्यम से छात्रों को सशक्त बनाने के लिए अपना ज्ञान साझा करने के लिए उत्सुक हूं। अधिक जाने