Matplotlib में केवल एक क्षैतिज ग्रिड कैसे प्लॉट करें
आप Matplotlib में केवल एक क्षैतिज ग्रिड प्लॉट करने के लिए निम्नलिखित मूल वाक्यविन्यास का उपयोग कर सकते हैं:
ax. grid (axis=' y ')
निम्नलिखित उदाहरण दिखाता है कि व्यवहार में इस वाक्यविन्यास का उपयोग कैसे करें।
उदाहरण: Matplotlib में केवल एक क्षैतिज ग्रिड प्लॉट करें
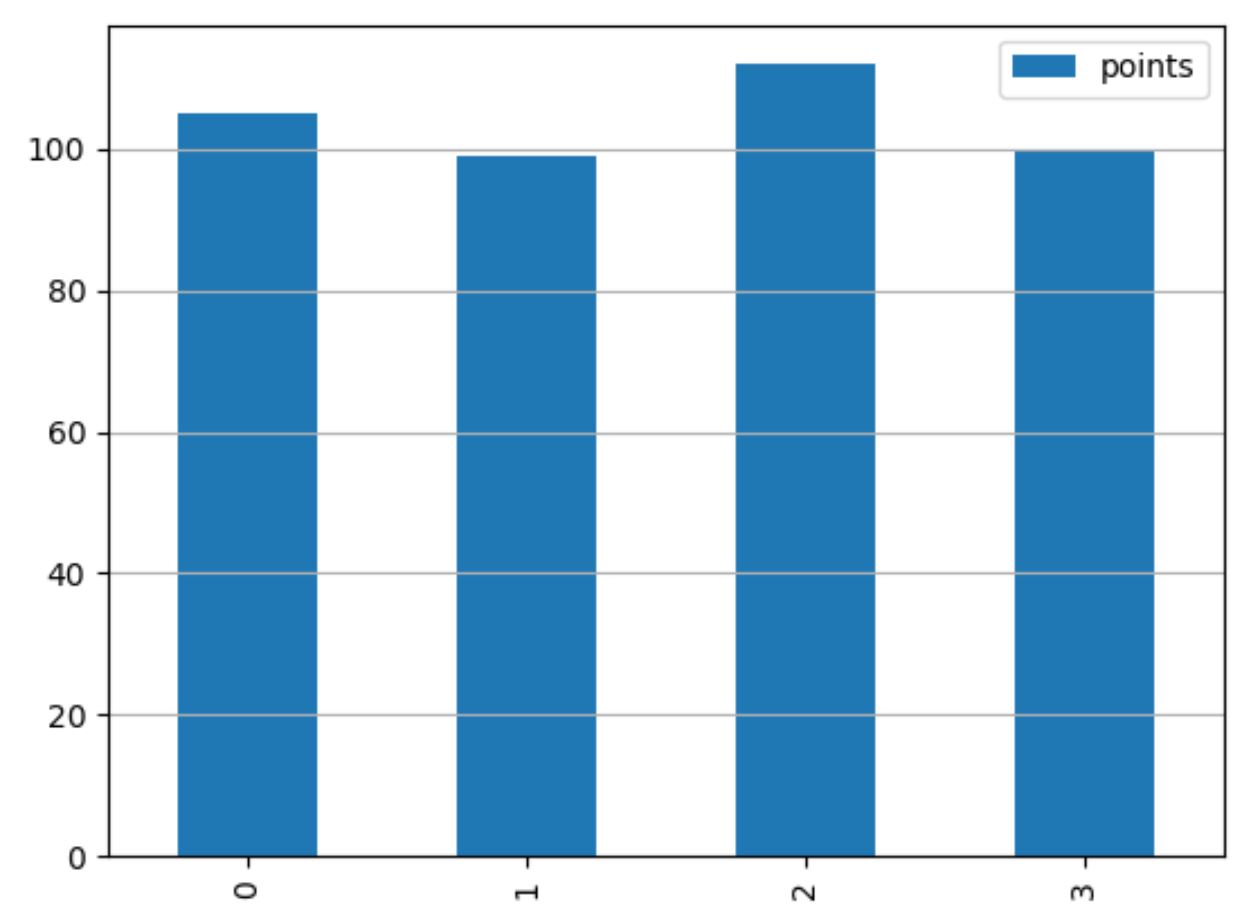
निम्नलिखित कोड दिखाता है कि प्लॉट में प्रदर्शित केवल एक क्षैतिज ग्रिड के साथ मैटप्लोटलिब में एक बार प्लॉट कैसे बनाया जाए:
 import pandas as pd
import matplotlib. pyplot as plt

#createDataFrame
df = pd. DataFrame ({' team ':['Mavs', 'Nets', 'Spurs', 'Warriors'],
                   ' points ':[105, 99, 112, 100]})

#defineplot
fig, ax = plt. subplots ()

#create bar plot
df. plot (kind=' bar ', ax=ax)

#add horizontal gridlines
ax. grid (axis=' y ')

#displayplot
plt. show ()
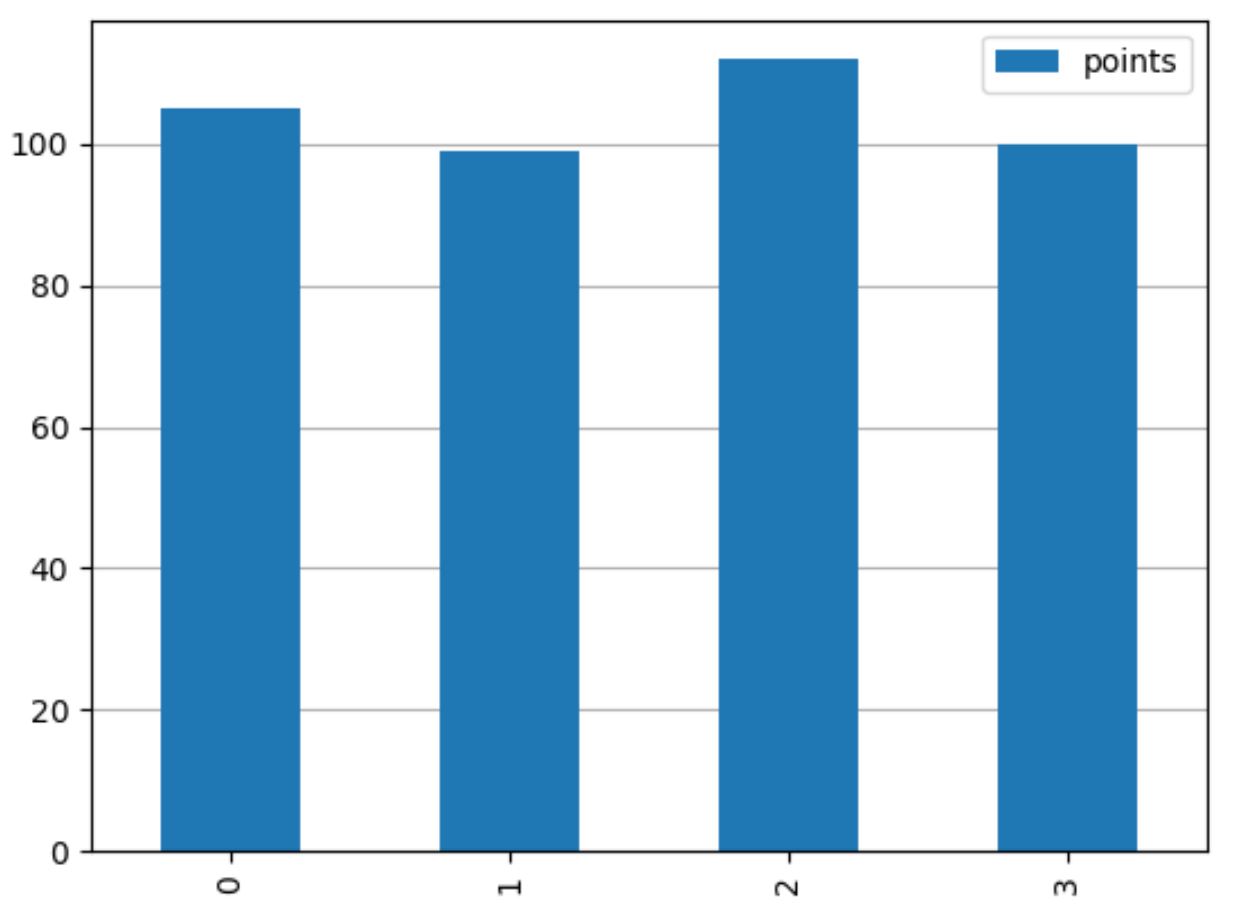
प्लॉट में सलाखों के पीछे क्षैतिज ग्रिडलाइन प्रदर्शित करने के लिए बेझिझक ax.set_axisbelow(True) का उपयोग करें:
 import pandas as pd
import matplotlib. pyplot as plt

#createDataFrame
df = pd. DataFrame ({' team ':['Mavs', 'Nets', 'Spurs', 'Warriors'],
                   ' points ':[105, 99, 112, 100]})

#defineplot
fig, ax = plt. subplots ()

#create bar plot
df. plot (kind=' bar ', ax=ax)

#add horizontal gridlines behind bars in the plot
ax. set_axisbelow ( True )
ax. grid (axis=' y ')

#displayplot
plt. show ()
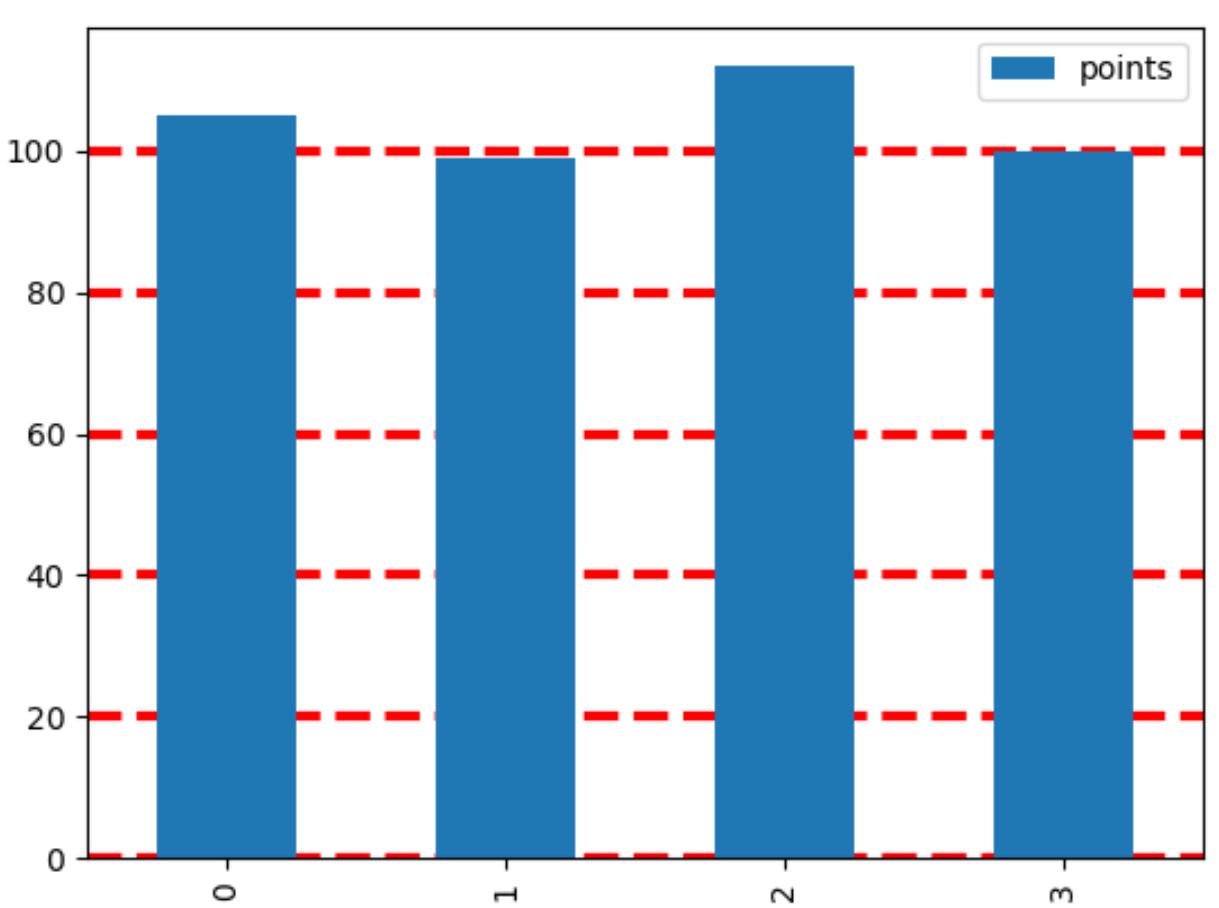
और ग्रिड की उपस्थिति को अनुकूलित करने के लिए ग्रिड() फ़ंक्शन में रंग , लाइनस्टाइल और लाइनविड्थ तर्कों का उपयोग करने के लिए स्वतंत्र महसूस करें:
 import pandas as pd
import matplotlib. pyplot as plt

#createDataFrame
df = pd. DataFrame ({' team ':['Mavs', 'Nets', 'Spurs', 'Warriors'],
                   ' points ':[105, 99, 112, 100]})

#defineplot
fig, ax = plt. subplots ()

#create bar plot
df. plot (kind=' bar ', ax=ax)

#add horizontal gridlines with custom appearance
ax. set_axisbelow ( True )
ax. grid (axis=' y ', color=' red ', linestyle=' dashed ', linewidth= 3 )

#displayplot
plt. show ()
आप Matplotlib दस्तावेज़ में ग्रिडलाइन्स को अनुकूलित करने के तरीकों की पूरी सूची पा सकते हैं।
अतिरिक्त संसाधन
निम्नलिखित ट्यूटोरियल बताते हैं कि मैटप्लोटलिब में अन्य सामान्य कार्य कैसे करें:
Matplotlib प्लॉट्स से टिक कैसे हटाएं
Matplotlib प्लॉट पर फ़ॉन्ट आकार कैसे बदलें
Matplotlib में प्लॉट करने के लिए औसत रेखा कैसे जोड़ें
लेखक के बारे में
डॉ. बेंजामिन एंडरसन
नमस्ते, मैं बेंजामिन हूं, एक सेवानिवृत्त सांख्यिकी प्रोफेसर जो अब समर्पित Statorials शिक्षक बन गया है। सांख्यिकी के क्षेत्र में व्यापक अनुभव और विशेषज्ञता के साथ, मैं Statorials के माध्यम से छात्रों को सशक्त बनाने के लिए अपना ज्ञान साझा करने के लिए उत्सुक हूं। अधिक जाने