Matplotlib में प्लॉट का आकार कैसे बढ़ाएं
आप Matplotlib में एकल प्लॉट का आकार बढ़ाने के लिए निम्नलिखित सिंटैक्स का उपयोग कर सकते हैं:
 import matplotlib. pyplot as plt

#define figure size in (width, height) for a single plot
plt. figure (figsize=(3,3))
और आप नोटबुक में सभी Matplotlib प्लॉट्स का आकार बढ़ाने के लिए निम्नलिखित सिंटैक्स का उपयोग कर सकते हैं:
 import matplotlib. pyplot as plt

#define figure size in (width, height) for all plots
plt. rcParams [' figure.figsize '] = [10, 7]
निम्नलिखित उदाहरण दिखाते हैं कि व्यवहार में इस वाक्यविन्यास का उपयोग कैसे करें।
उदाहरण 1: एकल मैटप्लोटलिब प्लॉट का आकार बढ़ाएँ
मान लीजिए कि हम Matplotlib में निम्नलिखित लाइन प्लॉट बनाते हैं:
 import matplotlib. pyplot as plt

#define x and y
x = [1, 6, 10]
y = [5, 13, 27]

#create plot of x and y
plt. plot (x, y)
plt. show ()
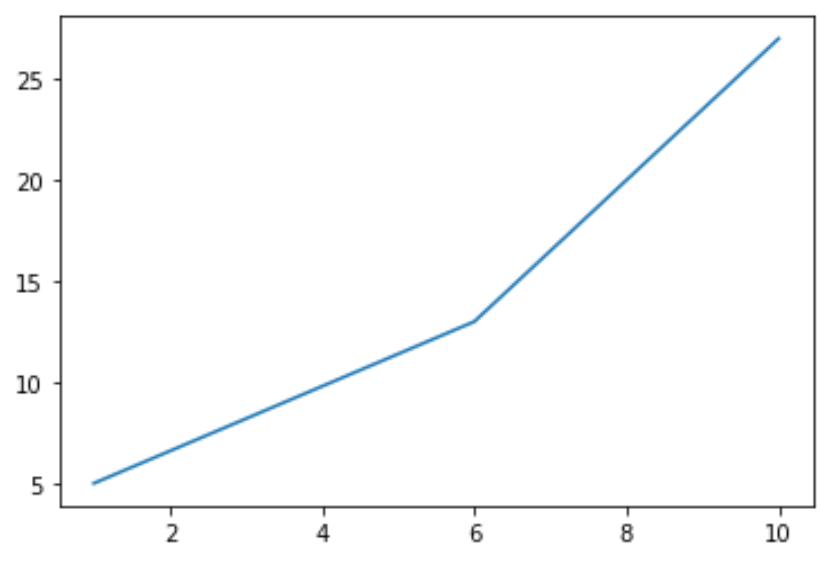
डिफ़ॉल्ट रूप से, मैटप्लोटलिब प्लॉट की (चौड़ाई, ऊंचाई) (6.4, 4.8) है।
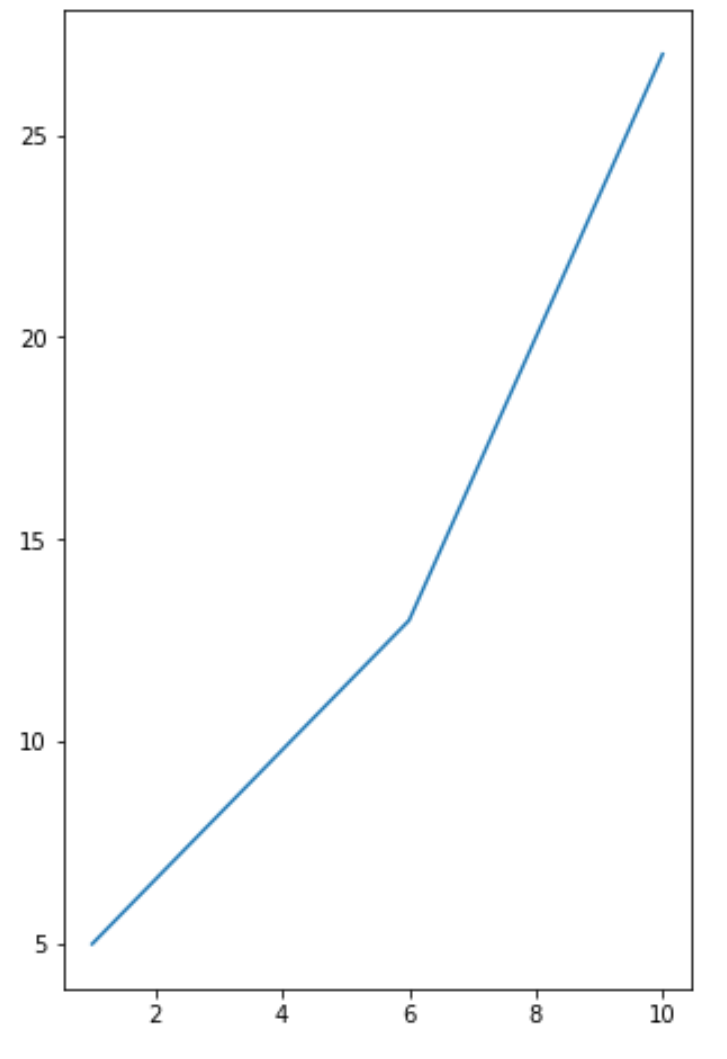
हालाँकि, हम प्लॉट के आकार को वांछित आयामों तक बढ़ाने के लिए निम्नलिखित सिंटैक्स का उपयोग कर सकते हैं:
 import matplotlib. pyplot as plt

#define plot size
plt. figure (figsize=(5,8))

#define x and y
x = [1, 6, 10]
y = [5, 13, 27]

#create plot of x and y
plt. plot (x, y)
plt. show ()
उदाहरण 2: सभी मैटप्लोटलिब प्लॉट का आकार बढ़ाएँ
निम्नलिखित कोड दिखाता है कि नोटबुक में सभी मैटप्लोटलिब प्लॉट के लिए प्लॉट का आकार कैसे सेट करें:
 import matplotlib. pyplot as plt

#define plot size for all plots
plt. rcParams [' figure.figsize '] = [10, 4]

#define first dataset
x = [1, 6, 10]
y = [5, 13, 27]

#create first plot
plt. plot (x, y)
plt. show ()

#define second dataset
x2 = [1, 6, 10]
y2 = [5, 19, 12]

#create second plot
plt. plot (x2, y2)
plt. show ()
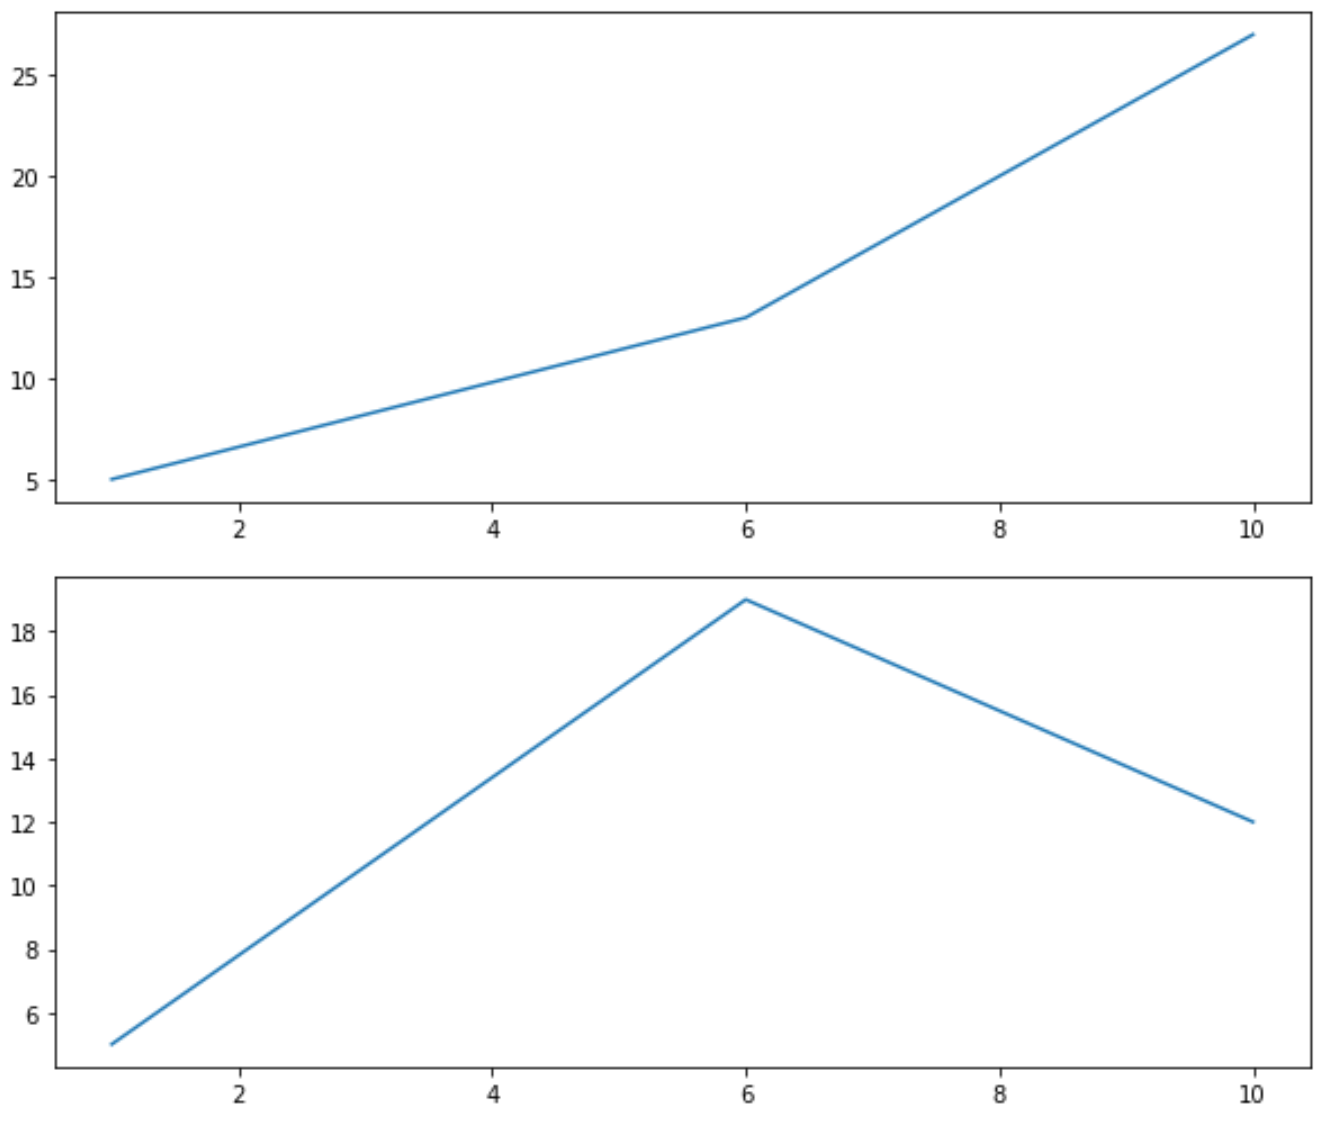
ध्यान दें कि दोनों प्लॉटों की चौड़ाई और ऊंचाई rcParams तर्कों द्वारा निर्दिष्ट है।
अतिरिक्त संसाधन
Matplotlib में मार्कर का आकार कैसे समायोजित करें
Matplotlib में फ़ॉन्ट आकार कैसे बदलें
Matplotlib में लाइन की मोटाई कैसे समायोजित करें
लेखक के बारे में
डॉ. बेंजामिन एंडरसन
नमस्ते, मैं बेंजामिन हूं, एक सेवानिवृत्त सांख्यिकी प्रोफेसर जो अब समर्पित Statorials शिक्षक बन गया है। सांख्यिकी के क्षेत्र में व्यापक अनुभव और विशेषज्ञता के साथ, मैं Statorials के माध्यम से छात्रों को सशक्त बनाने के लिए अपना ज्ञान साझा करने के लिए उत्सुक हूं। अधिक जाने