Matplotlib में सबप्लॉट आकार को कैसे समायोजित करें
आप Matplotlib में सबप्लॉट के आकार को समायोजित करने के लिए निम्नलिखित सिंटैक्स का उपयोग कर सकते हैं:
 #specify one size for all subplots
fig, ax = plt. subplots (2, 2, figsize=(10,7))

#specify individual sizes for subplots
fig, ax = plt. subplots (1, 2, gridspec_kw={' width_ratios ': [3, 1]})
निम्नलिखित उदाहरण दिखाते हैं कि व्यवहार में इस वाक्यविन्यास का उपयोग कैसे करें।
उदाहरण 1: सभी सबप्लॉट के लिए एक आकार निर्दिष्ट करें
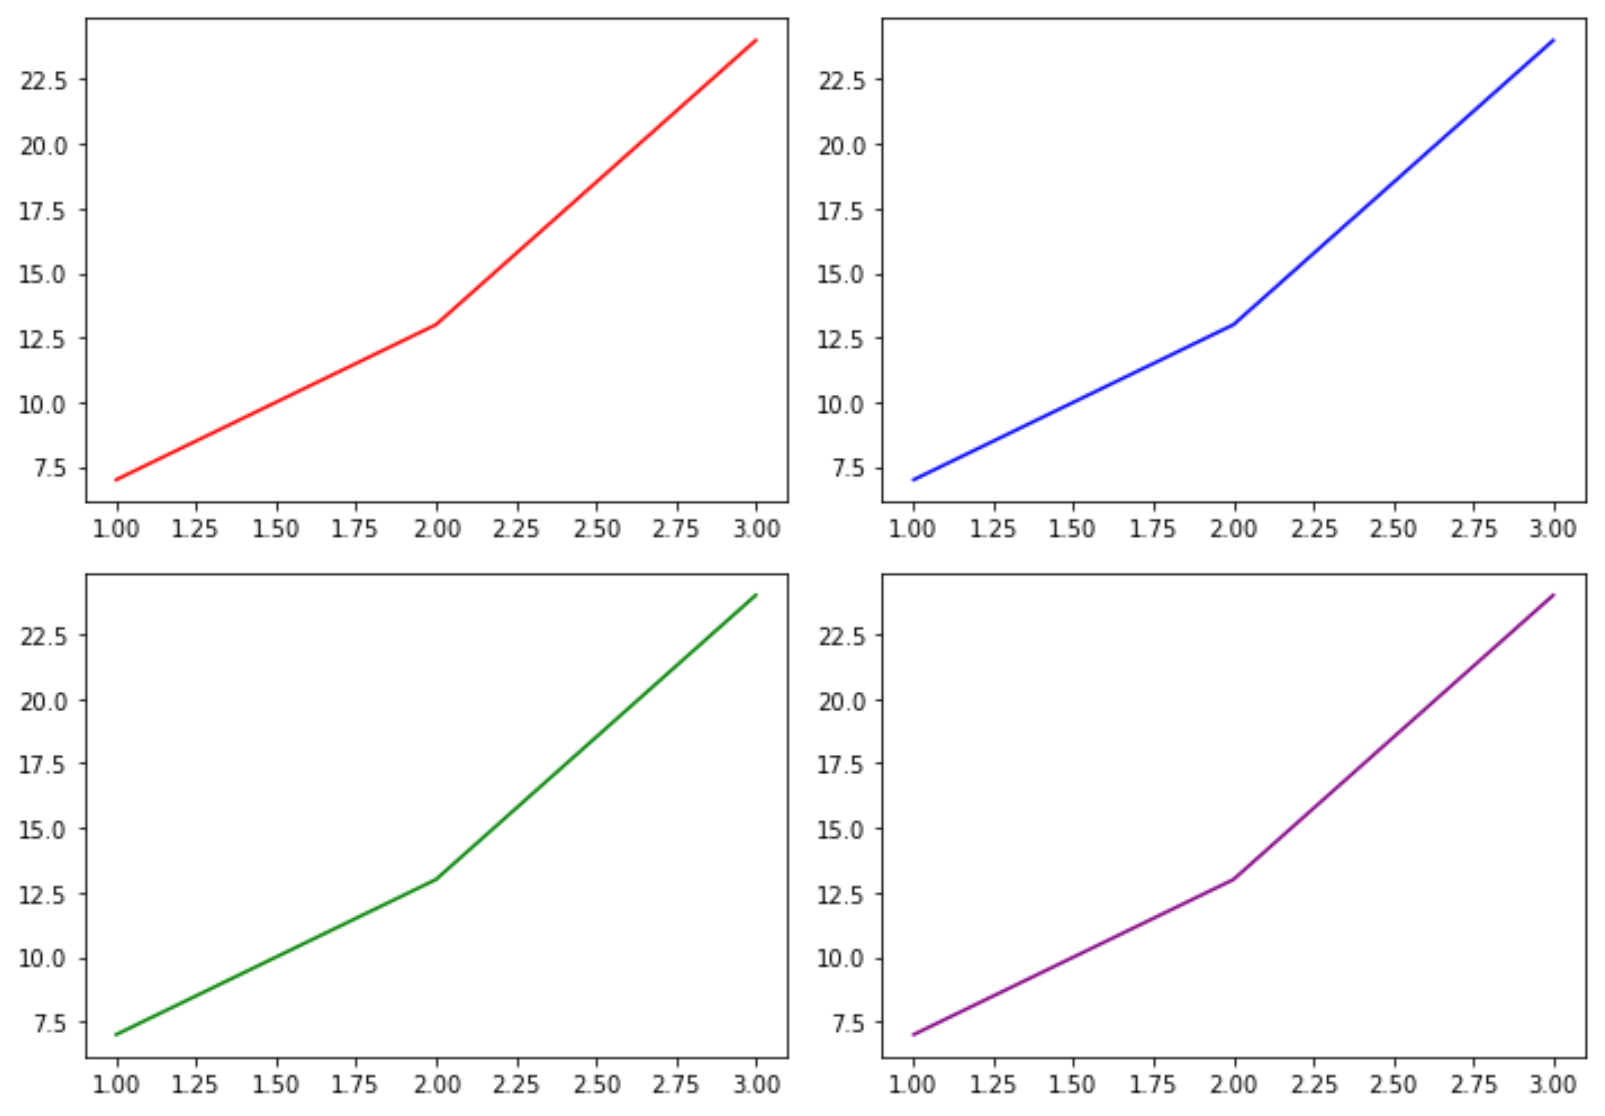
निम्नलिखित कोड दिखाता है कि सभी सबप्लॉट के लिए आकार कैसे निर्दिष्ट करें:
 import matplotlib. pyplot as plt

#define subplots
fig, ax = plt. subplots (2, 2, figsize=(10,7))
fig. tight_layout ()

#define data
x = [1, 2, 3]
y = [7, 13, 24]

#create subplots
ax[0, 0]. plot (x,y,color=' red ')
ax[0, 1]. plot (x,y,color=' blue ')
ax[1, 0]. plot (x,y,color=' green ')
ax[1, 1]. plot (x,y,color=' purple ')
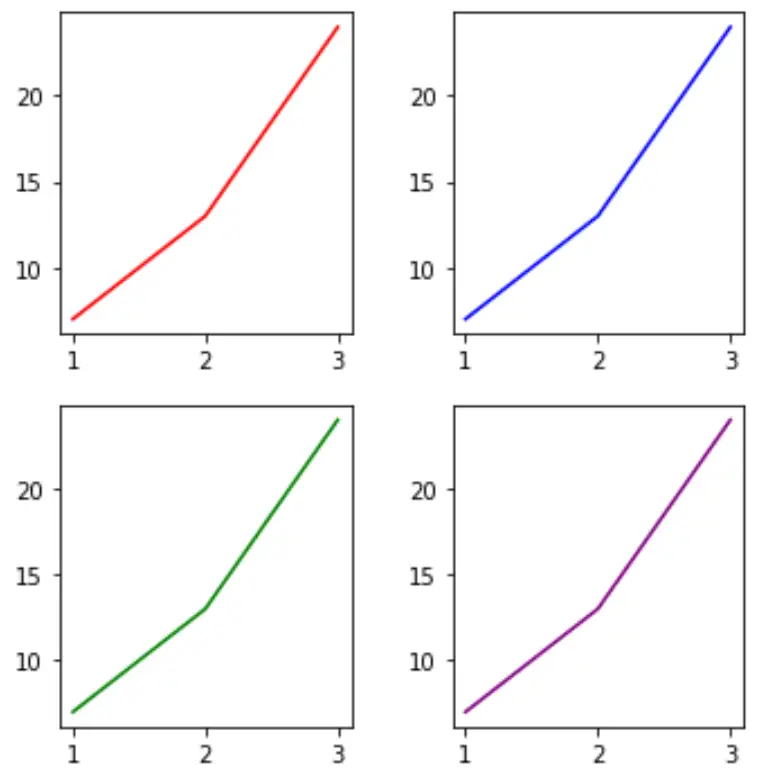
हम फिग्साइज़ तर्क के मानों को बदलकर उपप्रकारों का आकार आसानी से बदल सकते हैं:
 import matplotlib. pyplot as plt

#define subplots
fig, ax = plt. subplots (2, 2, figsize=(5,5))
fig. tight_layout ()

#define data
x = [1, 2, 3]
y = [7, 13, 24]

#create subplots
ax[0, 0]. plot (x,y,color=' red ')
ax[0, 1]. plot (x,y,color=' blue ')
ax[1, 0]. plot (x,y,color=' green ')
ax[1, 1]. plot (x,y,color=' purple ')
उदाहरण 2: अलग-अलग सबप्लॉट के आकार निर्दिष्ट करें
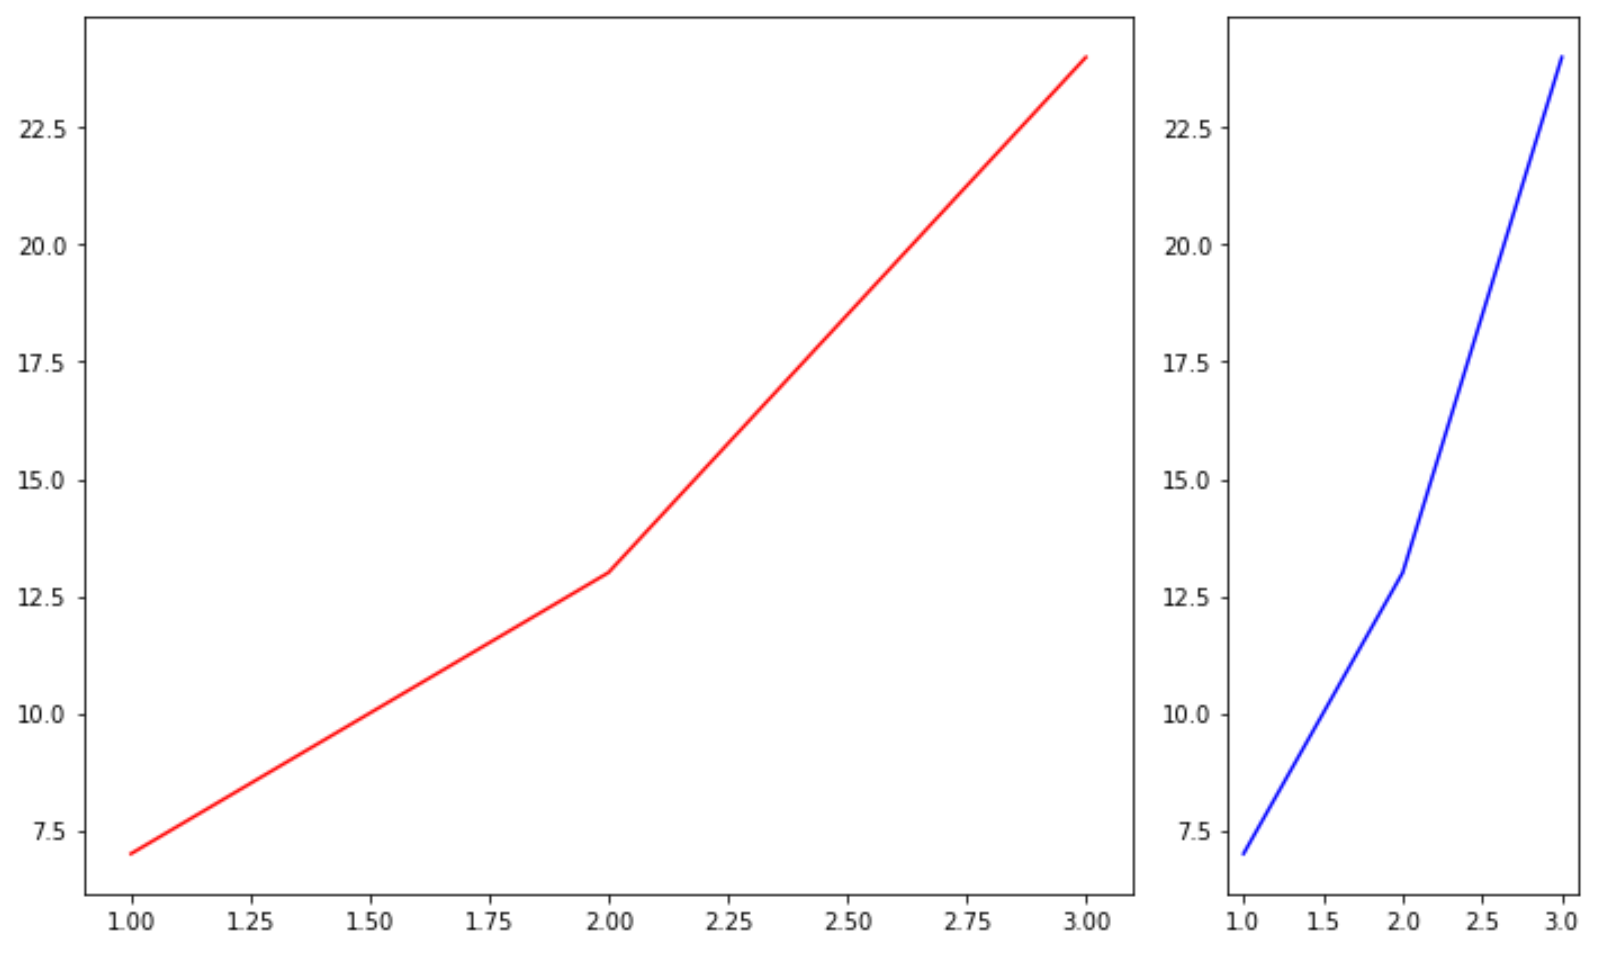
निम्नलिखित कोड दिखाता है कि अलग-अलग सबप्लॉट के लिए अलग-अलग आकार कैसे निर्दिष्ट करें:
 import matplotlib. pyplot as plt

#define subplots
fig, ax = plt. subplots (1, 2, gridspec_kw={' width_ratios ': [3, 1]})
fig. tight_layout ()

#define data
x = [1, 2, 3]
y = [7, 13, 24]

#create subplots
ax[0]. plot (x,y,color=' red ')
ax[1]. plot (x,y,color=' blue ')
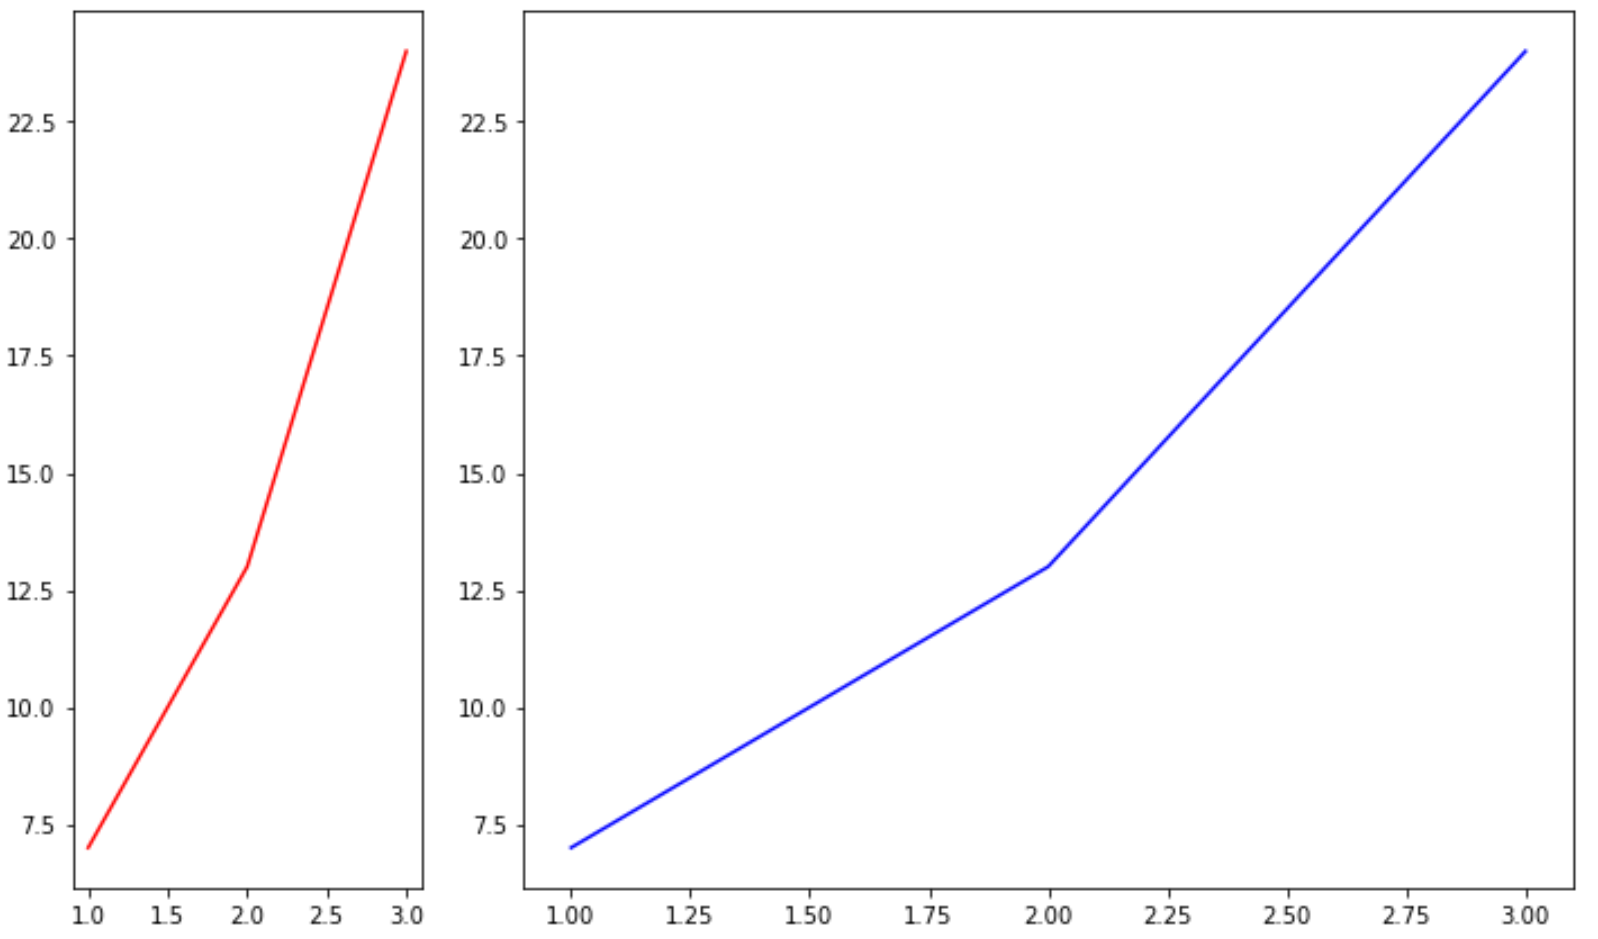
हम width_ratios तर्क में मानों को बदलकर उपप्रकारों का आकार आसानी से बदल सकते हैं:
 import matplotlib. pyplot as plt

#define subplots
fig, ax = plt. subplots (1, 2, gridspec_kw={' width_ratios ': [1, 3]})
fig. tight_layout ()

#define data
x = [1, 2, 3]
y = [7, 13, 24]

#create subplots
ax[0]. plot (x,y,color=' red ')
ax[1]. plot (x,y,color=' blue ')
अतिरिक्त संसाधन
Matplotlib में प्लॉट में शीर्षक कैसे जोड़ें
Matplotlib में अक्ष श्रेणियाँ कैसे सेट करें
Matplotlib में X अक्ष मान कैसे सेट करें
लेखक के बारे में
डॉ. बेंजामिन एंडरसन
नमस्ते, मैं बेंजामिन हूं, एक सेवानिवृत्त सांख्यिकी प्रोफेसर जो अब समर्पित Statorials शिक्षक बन गया है। सांख्यिकी के क्षेत्र में व्यापक अनुभव और विशेषज्ञता के साथ, मैं Statorials के माध्यम से छात्रों को सशक्त बनाने के लिए अपना ज्ञान साझा करने के लिए उत्सुक हूं। अधिक जाने