Ggplot2 में साइड-बाय-साइड प्लॉट कैसे बनाएं
अक्सर, आप R में ggplot2 पैकेज का उपयोग करके एक साथ दो प्लॉट बनाना चाह सकते हैं। सौभाग्य से, पैचवर्क पैकेज की मदद से ऐसा करना आसान है।
 #install ggplot2 and patchwork packages
install.packages(' ggplot2 ')
install.packages(' patchwork ')

#load the packages
library(ggplot2)
library(patchwork)
यह ट्यूटोरियल साइड-बाय-साइड प्लॉट बनाने के लिए इन पैकेजों का उपयोग करने के कई उदाहरण दिखाता है।
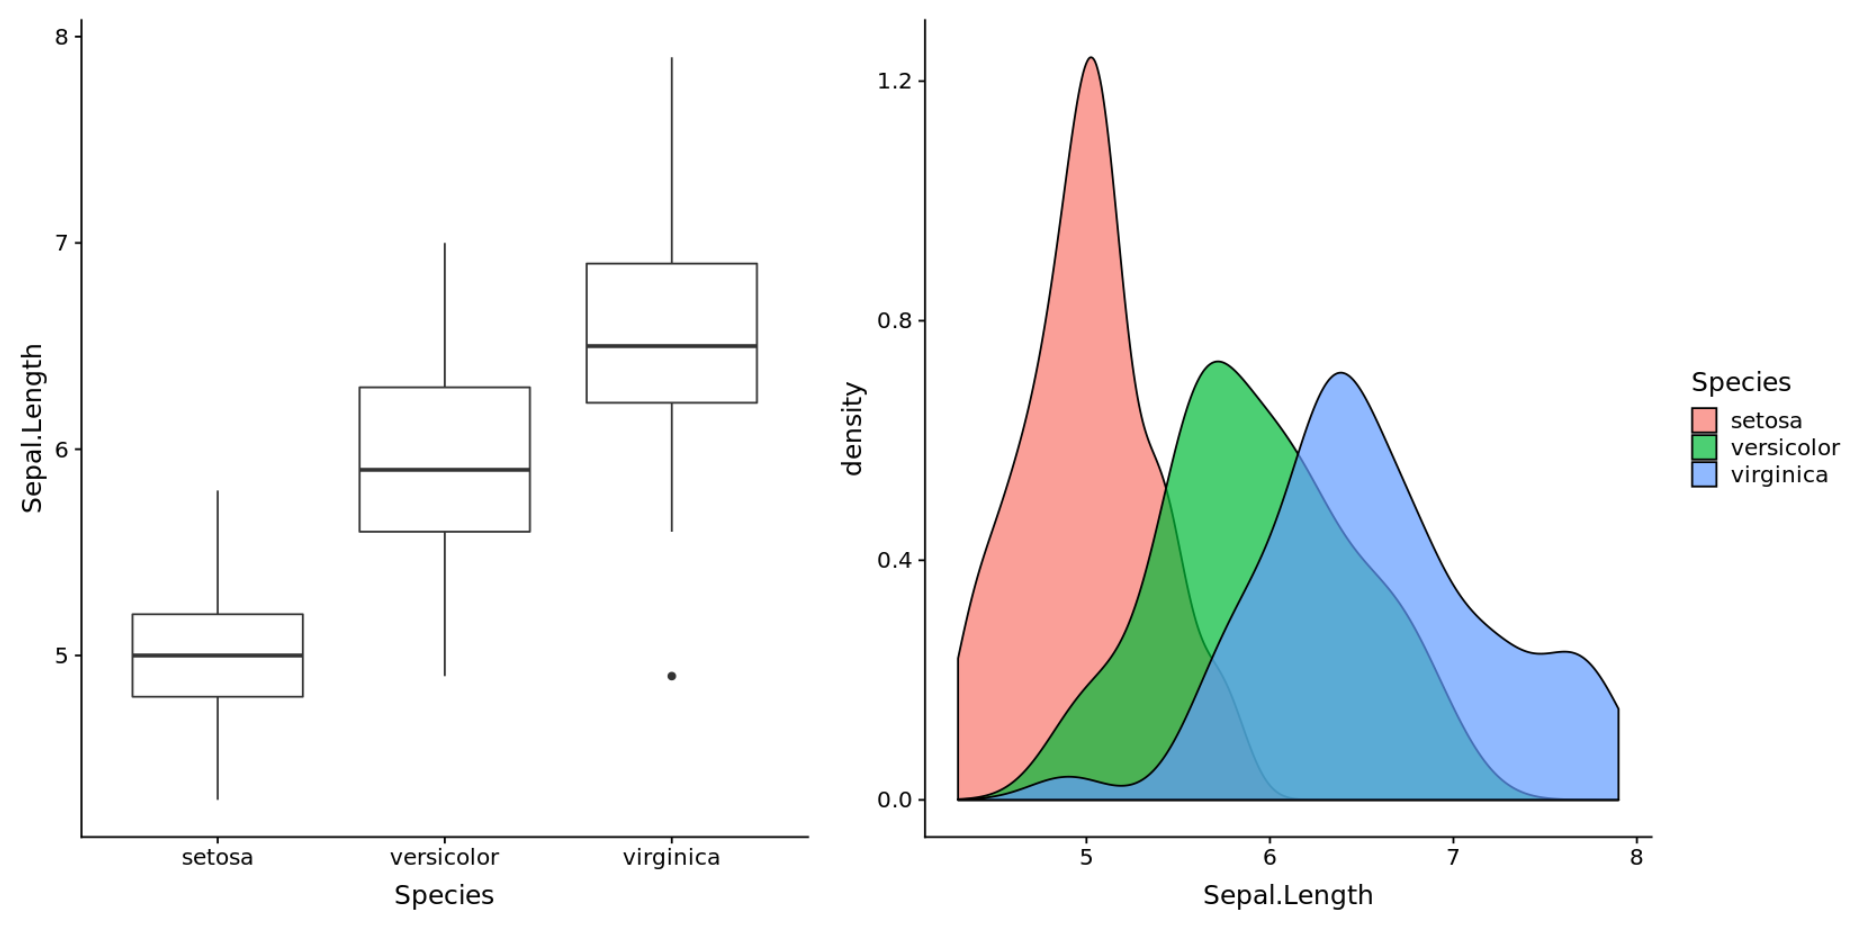
उदाहरण 1: दो प्लॉट अगल-बगल
निम्नलिखित कोड दिखाता है कि आर के अंतर्निहित आईरिस डेटासेट का उपयोग करके दो साइड-बाय-साइड प्लॉट कैसे बनाएं:
 #create box plot
plot1 <- ggplot(iris, aes(x = Species, y = Sepal.Length)) +
  geom_boxplot()

#create density plot
plot2 <- ggplot(iris, aes(x = Sepal.Length, fill = Species)) +
  geom_density(alpha = 0.8)

#display plots side by side
plot1 + plot2
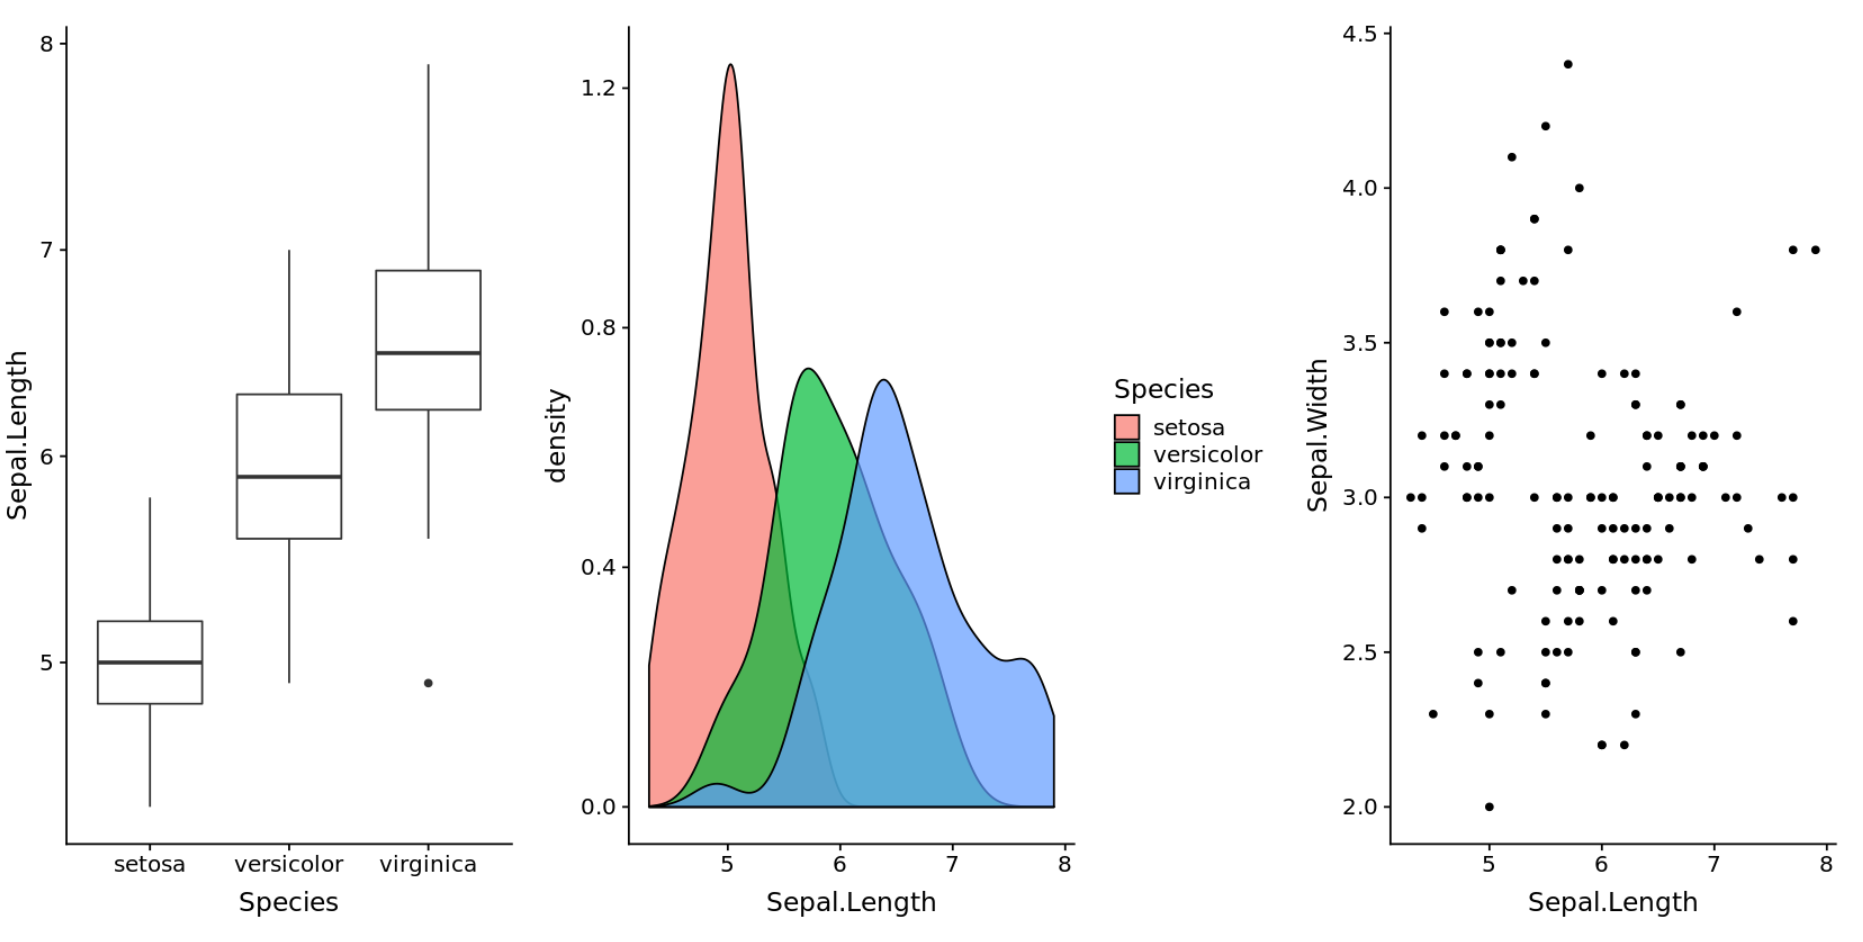
उदाहरण 2: तीन प्लॉट अगल-बगल
निम्नलिखित कोड दिखाता है कि आर के अंतर्निहित आईरिस डेटासेट का उपयोग करके तीन साइड-बाय-साइड प्लॉट कैसे बनाएं:
 #create box plot
plot1 <- ggplot(iris, aes(x = Species, y = Sepal.Length)) +
  geom_boxplot()

#create density plot
plot2 <- ggplot(iris, aes(x = Sepal.Length, fill = Species)) +
  geom_density(alpha = 0.7)

#create scatterplot
plot3 <- ggplot(iris, aes(x = Sepal.Length, y = Sepal.Width)) +
  geom_point()

#display three plots side by side
plot1 + plot2 + plot3
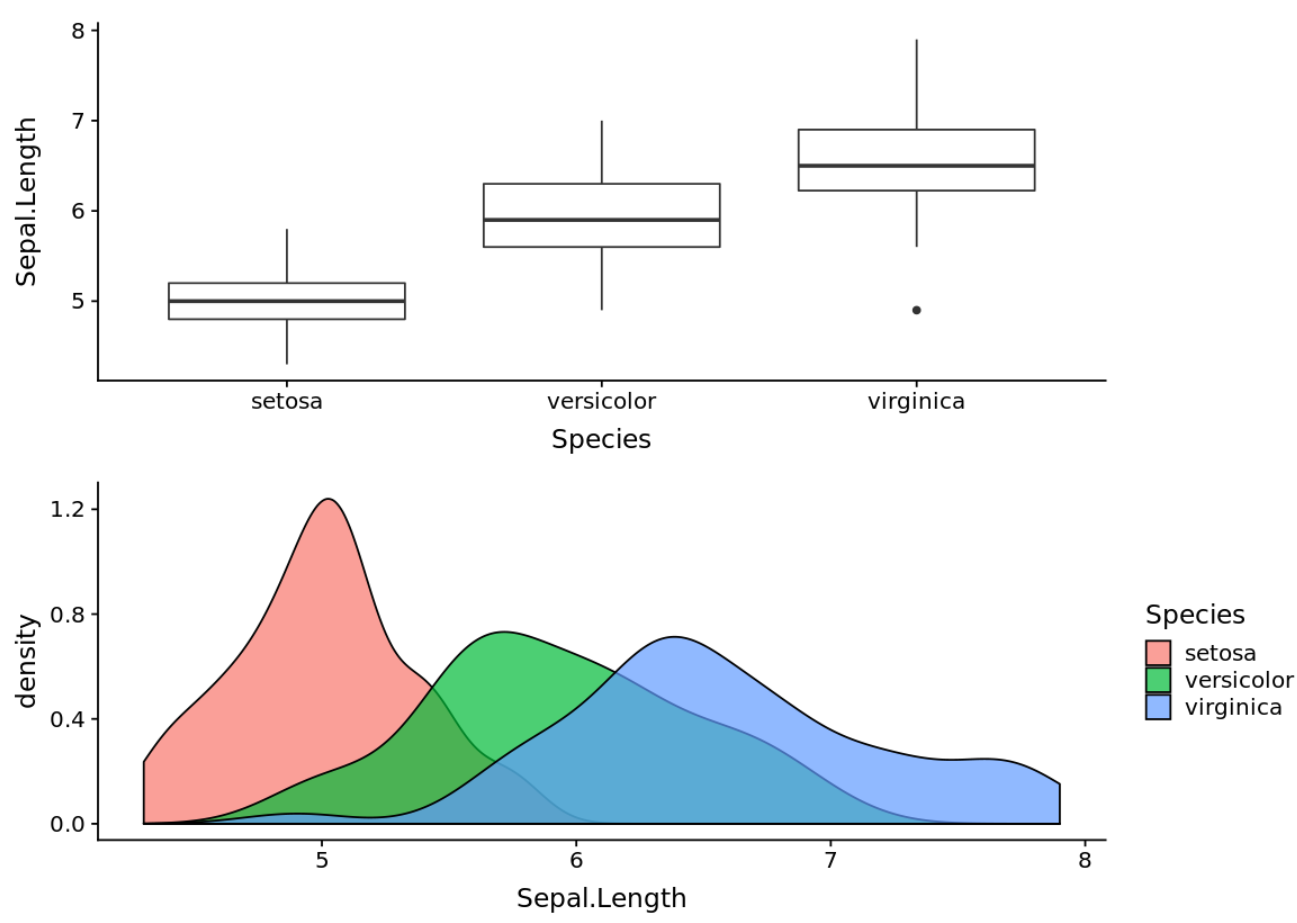
उदाहरण 3: दो स्टैक्ड प्लॉट
निम्नलिखित कोड दिखाता है कि दो स्टैक्ड प्लॉट कैसे बनाएं, एक के ऊपर एक:
 #create box plot
plot1 <- ggplot(iris, aes(x = Species, y = Sepal.Length)) +
  geom_boxplot()

#create density plot
plot2 <- ggplot(iris, aes(x = Sepal.Length, fill = Species)) +
  geom_density(alpha = 0.7)

#display plots stacked on top of each other
plot1 / plot2
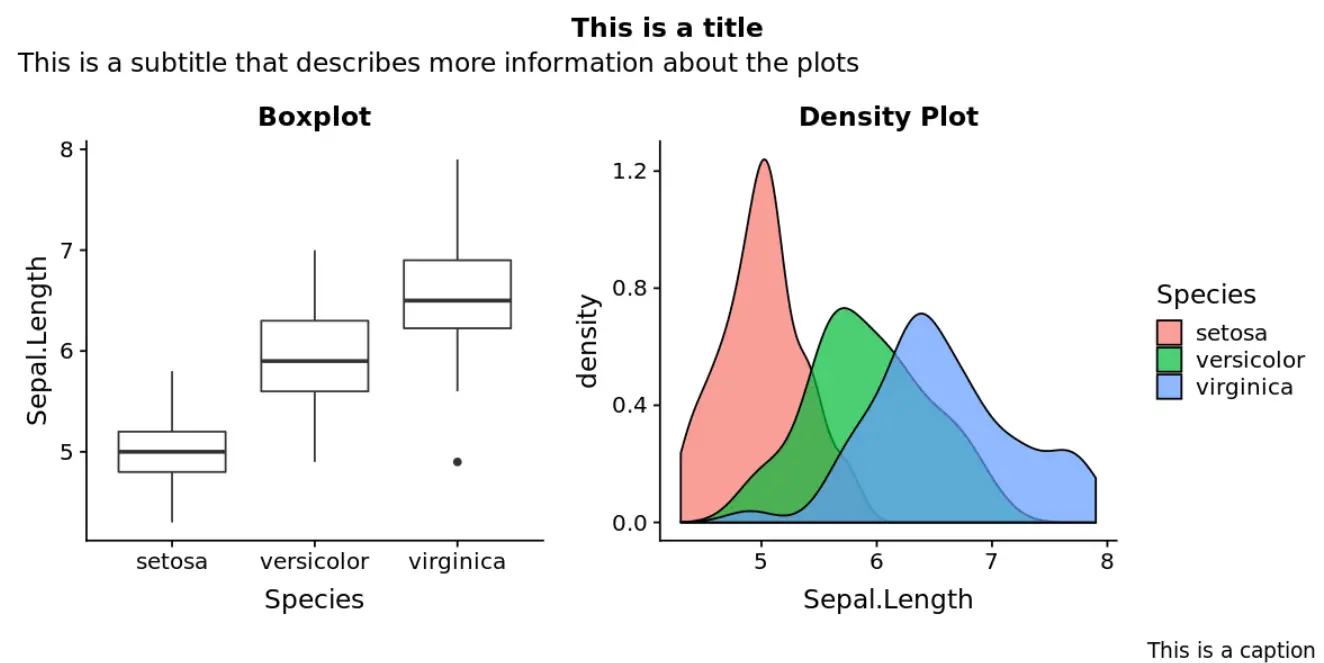
उदाहरण 4: शीर्षक, उपशीर्षक और कैप्शन जोड़ें
निम्नलिखित कोड दिखाता है कि प्लॉट में शीर्षक, उपशीर्षक और कैप्शन कैसे जोड़ें:
 #create box plot
plot1 <- ggplot(iris, aes(x = Species, y = Sepal.Length)) +
  geom_boxplot() +
  ggtitle('Boxplot')

#create density plot
plot2 <- ggplot(iris, aes(x = Sepal.Length, fill = Species)) +
  geom_density(alpha = 0.7) +
  ggtitle('Density Plot')

#display plots side by side with title, subtitle, and captions
patchwork <- plot1 + plot2

patchwork + plot_annotation(
  title = ' This is a title ',
  subtitle = ' This is a subtitle that describes more information about the plots ',
  caption = ' This is a caption '
)
आप यहां अधिक आर ट्यूटोरियल पा सकते हैं।
लेखक के बारे में
डॉ. बेंजामिन एंडरसन
नमस्ते, मैं बेंजामिन हूं, एक सेवानिवृत्त सांख्यिकी प्रोफेसर जो अब समर्पित Statorials शिक्षक बन गया है। सांख्यिकी के क्षेत्र में व्यापक अनुभव और विशेषज्ञता के साथ, मैं Statorials के माध्यम से छात्रों को सशक्त बनाने के लिए अपना ज्ञान साझा करने के लिए उत्सुक हूं। अधिक जाने