आर में बीटा वितरण कैसे प्लॉट करें (उदाहरण के साथ)
आप R में बीटा वितरण को प्लॉट करने के लिए निम्नलिखित सिंटैक्स का उपयोग कर सकते हैं:
 #define range
p = seq(0, 1, length= 100 )

#create plot of Beta distribution with shape parameters 2 and 10
plot(p, dbeta(p, 2, 10), type=' l ')
निम्नलिखित उदाहरण दिखाते हैं कि व्यवहार में इस वाक्यविन्यास का उपयोग कैसे करें।
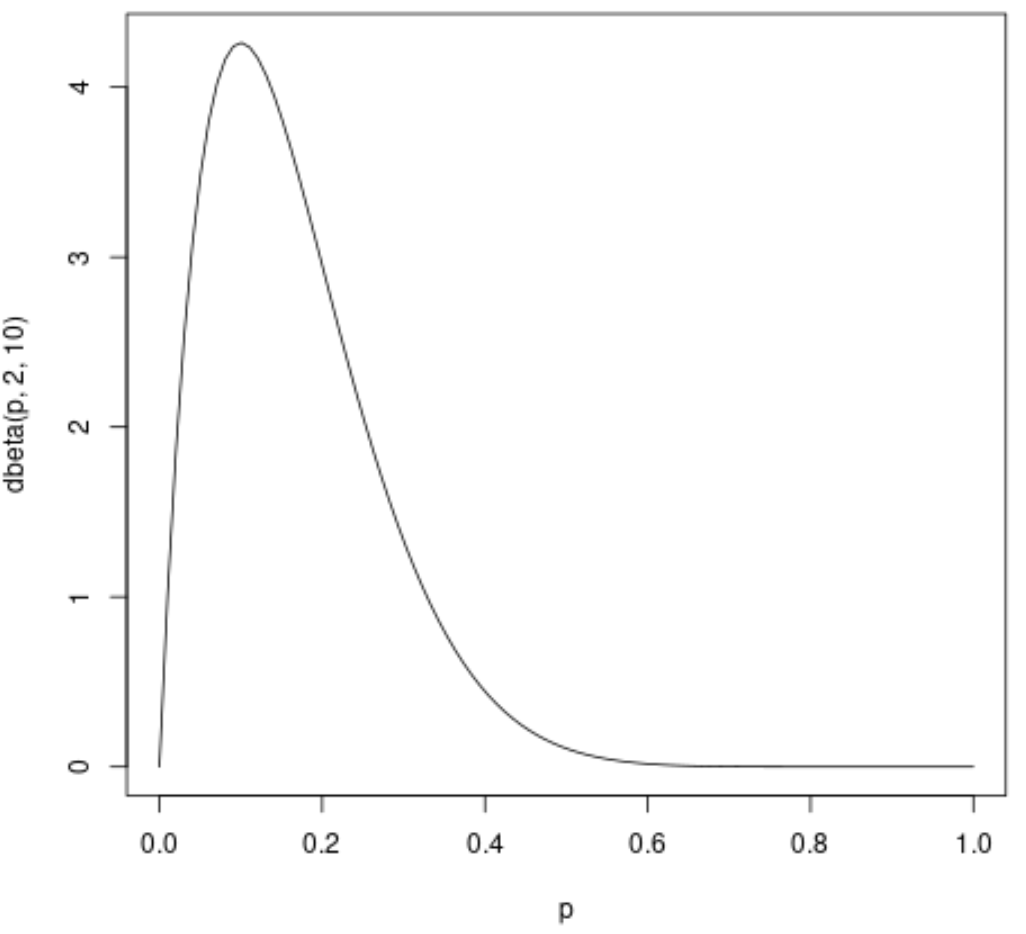
उदाहरण 1: बीटा वितरण प्लॉट करना
निम्नलिखित कोड दिखाता है कि एकल बीटा वितरण को कैसे प्लॉट किया जाए:
 #define range
p = seq(0,1, length=100)

#create plot of Beta distribution with shape parameters 2 and 10
plot(p, dbeta(p, 2, 10), type=' l ')
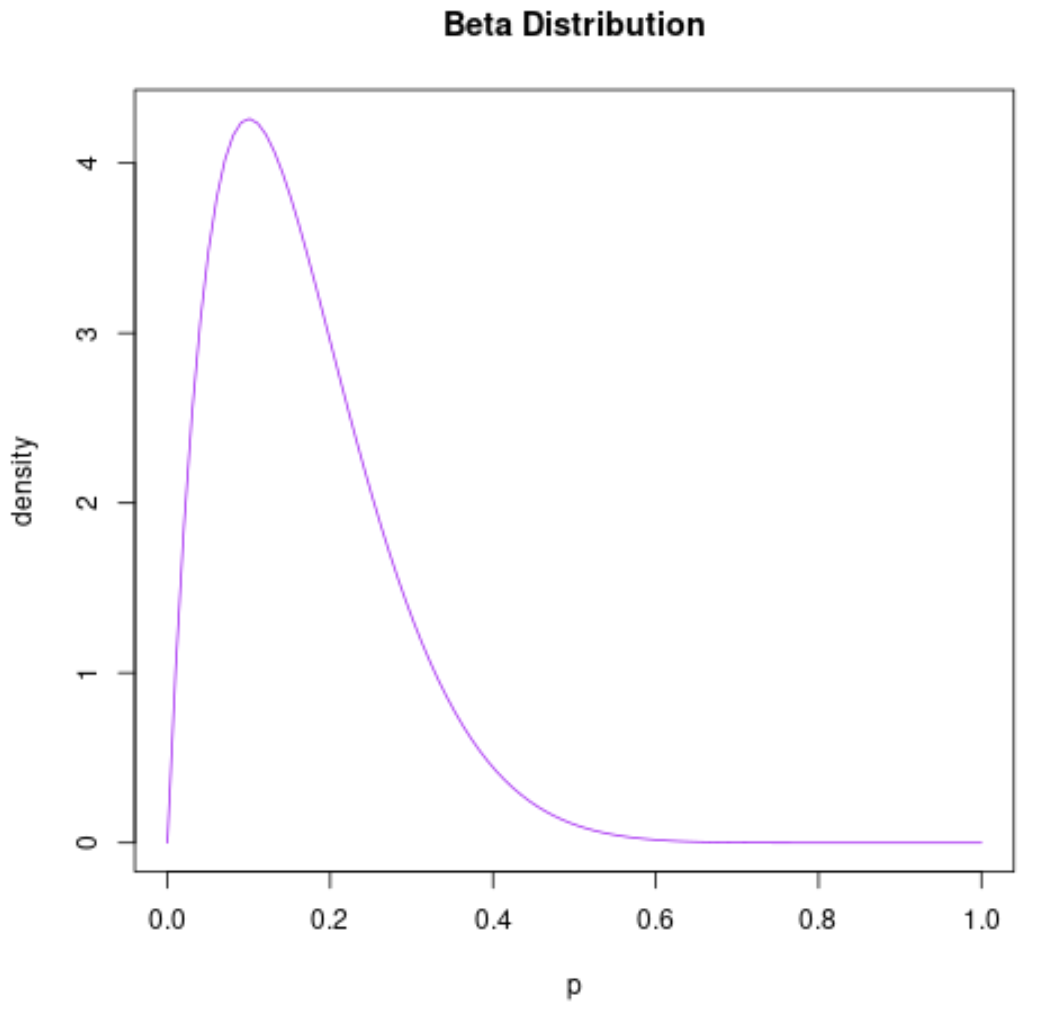
आप प्लॉट अक्षों के रंग और लेबल को भी अनुकूलित कर सकते हैं:
 #define range
p = seq(0,1, length=100)

#create custom plot of Beta distribution
plot(p, dbeta(p, 2, 10), ylab=' density ',
     type=' l ', col=' purple ', main=' Beta Distribution ')
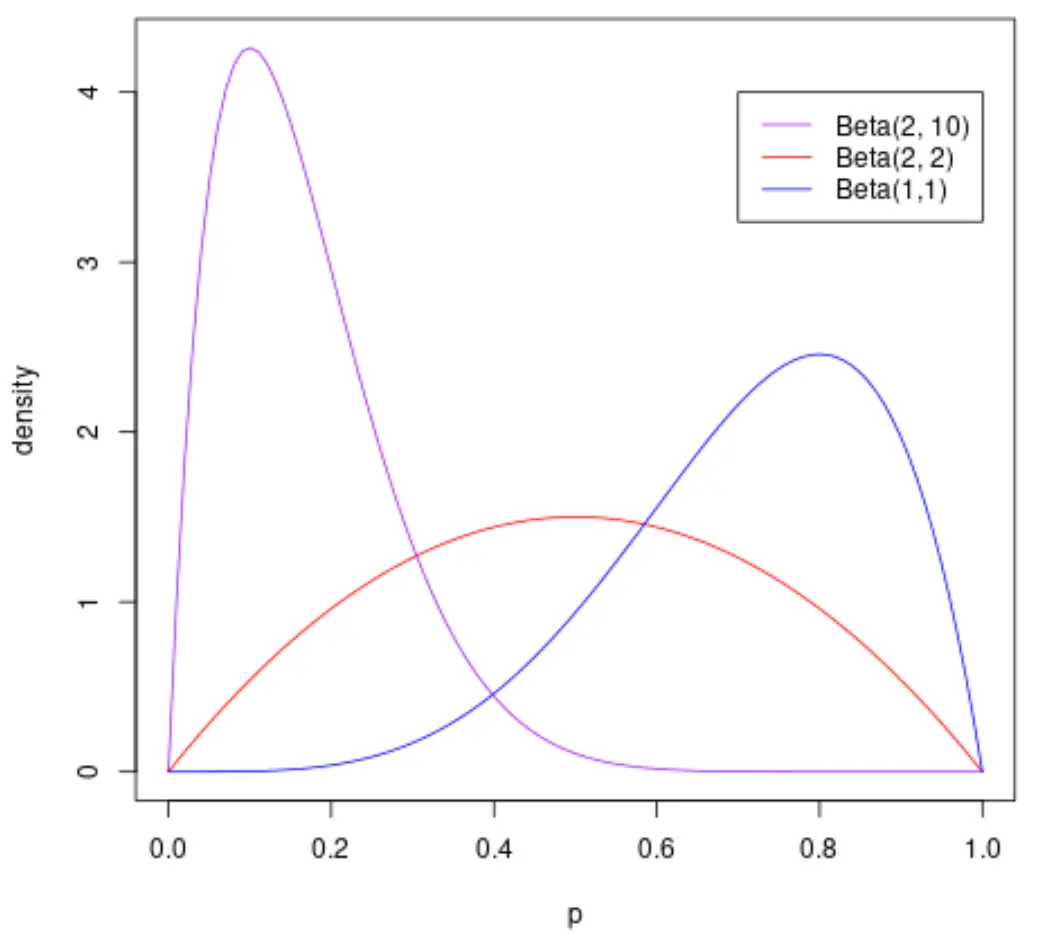
उदाहरण 2: एकाधिक बीटा वितरण प्लॉट करना
निम्नलिखित कोड दिखाता है कि विभिन्न आकार मापदंडों के साथ एकाधिक बीटा वितरणों को कैसे प्लॉट किया जाए:
 #define range
p = seq(0,1, length=100)

#plot several Beta distributions
plot(p, dbeta(p, 2, 10), ylab=' density ', type =' l ', col=' purple ')
lines(p, dbeta(p, 2, 2), col=' red ')
lines(p, dbeta(p, 5, 2), col=' blue ')

#add legend
legend(.7, 4, c(' Beta(2,10) ',' Beta(2,2) ',' Beta(1,1) '),
       lty=c(1,1,1),col=c(' purple ', ' red ', ' blue '))
अतिरिक्त संसाधन
निम्नलिखित ट्यूटोरियल बताते हैं कि आर में अन्य सामान्य वितरणों को कैसे प्लॉट किया जाए:
आर में सामान्य वितरण कैसे प्लॉट करें
आर में ची-स्क्वायर वितरण कैसे प्लॉट करें
R में द्विपद बंटन कैसे आलेखित करें
आर में पॉइसन वितरण कैसे प्लॉट करें
लेखक के बारे में
डॉ. बेंजामिन एंडरसन
नमस्ते, मैं बेंजामिन हूं, एक सेवानिवृत्त सांख्यिकी प्रोफेसर जो अब समर्पित Statorials शिक्षक बन गया है। सांख्यिकी के क्षेत्र में व्यापक अनुभव और विशेषज्ञता के साथ, मैं Statorials के माध्यम से छात्रों को सशक्त बनाने के लिए अपना ज्ञान साझा करने के लिए उत्सुक हूं। अधिक जाने