Ggplot2 में फ़ैक्टर द्वारा रंग कैसे निर्दिष्ट करें (उदाहरण के साथ)
अक्सर आप श्रेणीबद्ध चर के आधार पर ggplot2 प्लॉट में बिंदुओं को रंग निर्दिष्ट करना चाह सकते हैं।
सौभाग्य से, निम्नलिखित सिंटैक्स का उपयोग करके ऐसा करना आसान है:
 ggplot(df, aes (x=x_variable, y=y_variable, color=color_variable)) +
  geom_point()
यह ट्यूटोरियल आईरिस नामक अंतर्निहित आर डेटासेट का उपयोग करके इस सिंटैक्स का व्यावहारिक रूप से उपयोग करने के कई उदाहरण प्रदान करता है:
 #view first six rows of iris dataset
head(iris)

  Sepal.Length Sepal.Width Petal.Length Petal.Width Species
1 5.1 3.5 1.4 0.2 setosa
2 4.9 3.0 1.4 0.2 setosa
3 4.7 3.2 1.3 0.2 setosa
4 4.6 3.1 1.5 0.2 setosa
5 5.0 3.6 1.4 0.2 setosa
6 5.4 3.9 1.7 0.4 setosa
उदाहरण 1: डिफ़ॉल्ट रंगों का उपयोग करें
निम्नलिखित कोड दिखाता है कि प्रजाति फैक्टोरियल वैरिएबल के आधार पर ggplot2 प्लॉट में बिंदुओं को डिफ़ॉल्ट रंग कैसे निर्दिष्ट किया जाए:
 library (ggplot2)

ggplot(iris, aes (x=Sepal.Length, y=Sepal.Width, color=Species)) +
  geom_point()
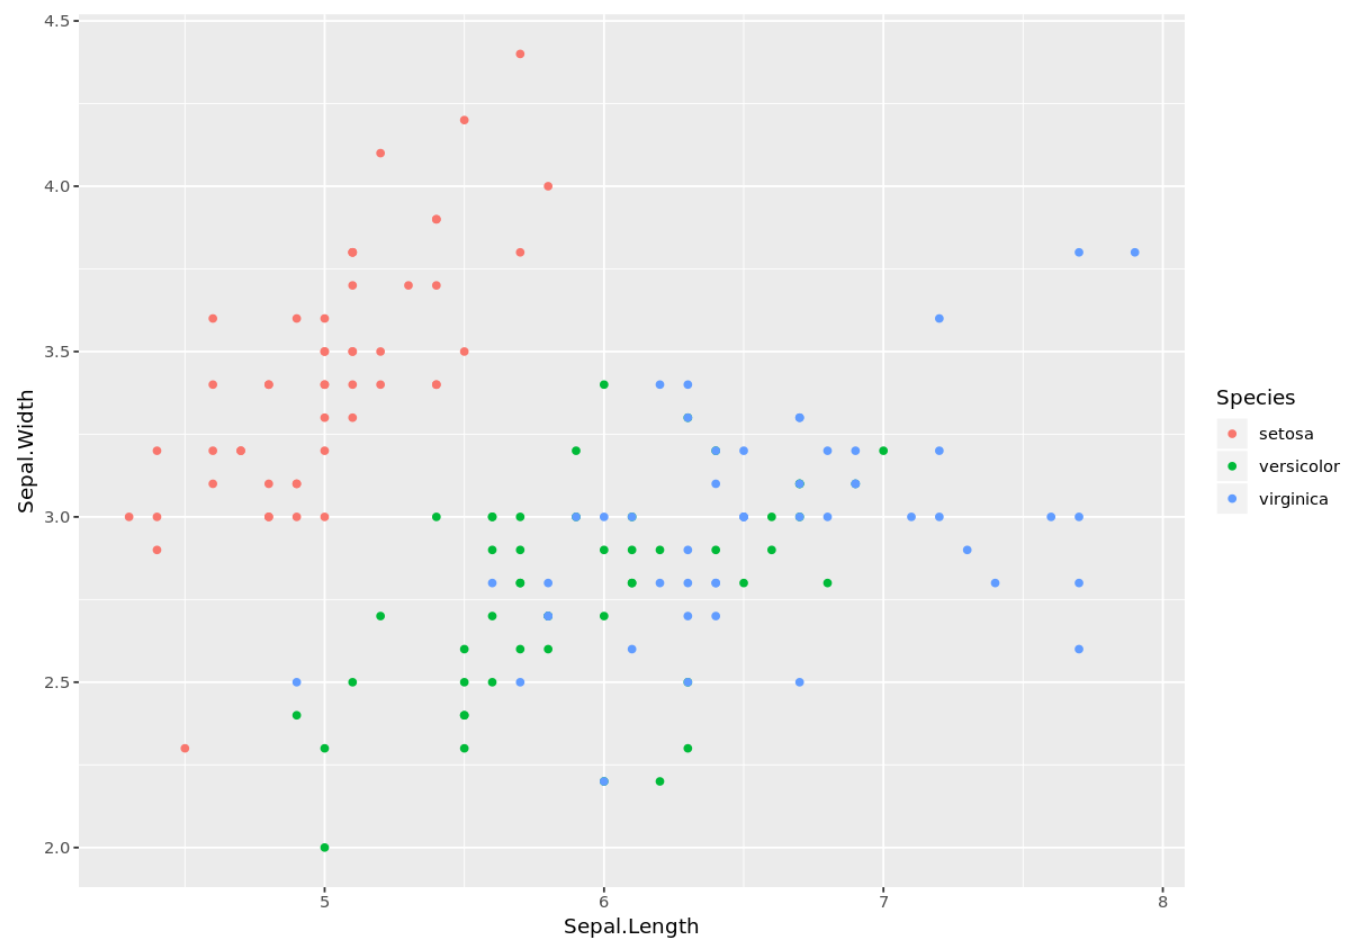
चूँकि हमने कोई रंग स्केल या कस्टम रंग सूची निर्दिष्ट नहीं की है, ggplot2 ने केवल बिंदुओं के लिए एक डिफ़ॉल्ट लाल, हरा और नीला रंग सूची निर्दिष्ट की है।
उदाहरण 2: कस्टम रंगों का उपयोग करें
निम्नलिखित कोड दिखाता है कि स्केल_कलर_मैनुअल() का उपयोग करके ggplot2 प्लॉट में बिंदुओं पर कस्टम रंग कैसे निर्दिष्ट करें:
 library (ggplot2)

ggplot(iris, aes (x=Sepal.Length, y=Sepal.Width, color=Species)) +
  geom_point() +
  scale_color_manual( values = c(" setosa " = " purple ",
                                " versicolor =" orange ",
                                " virginica "=" steelblue "))
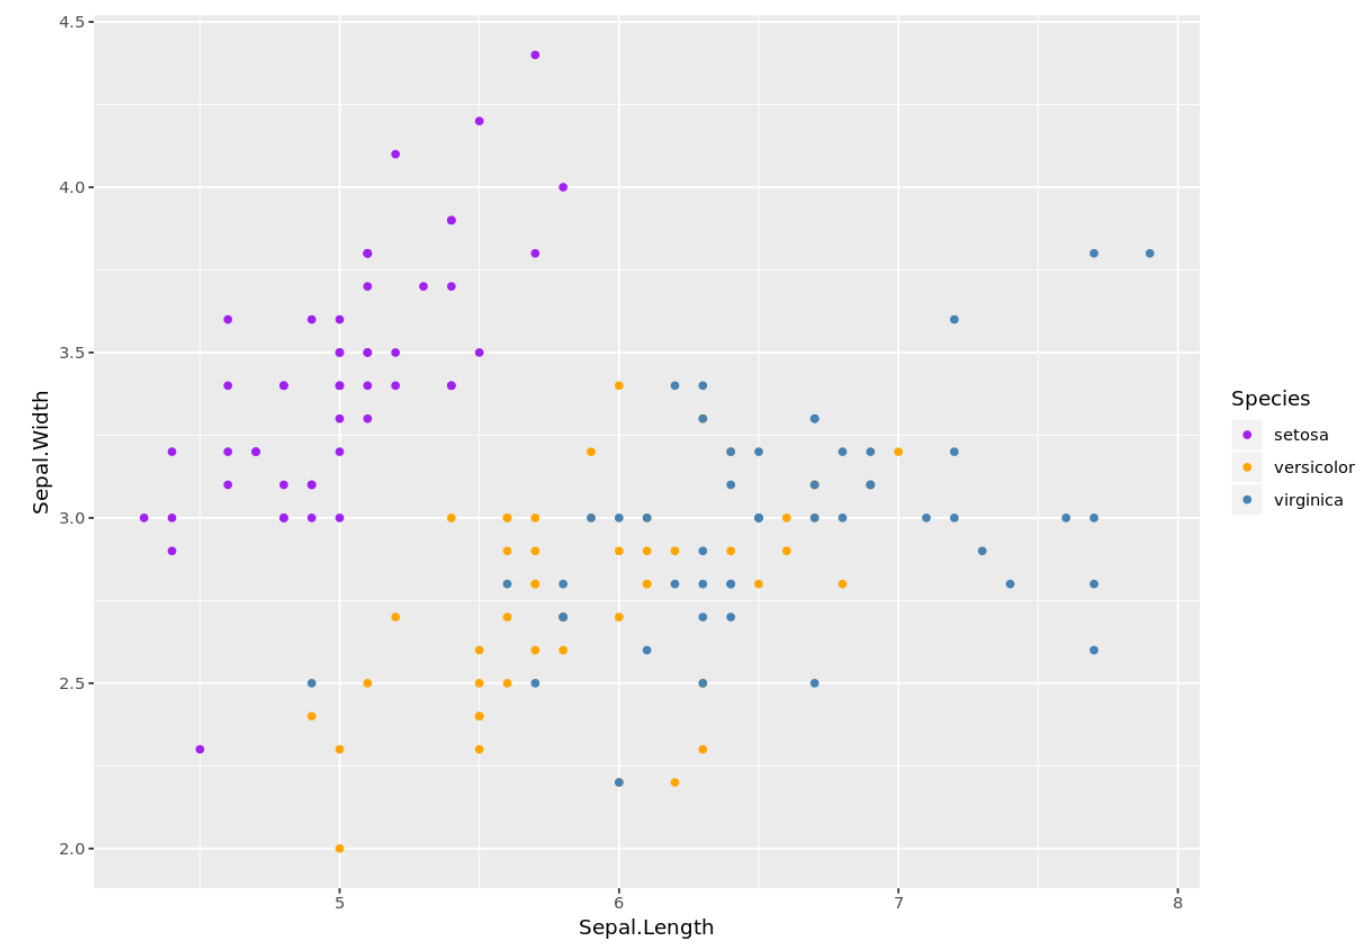
ध्यान दें कि हम रंग निर्दिष्ट करने के लिए हेक्साडेसिमल रंग कोड का भी उपयोग कर सकते थे।
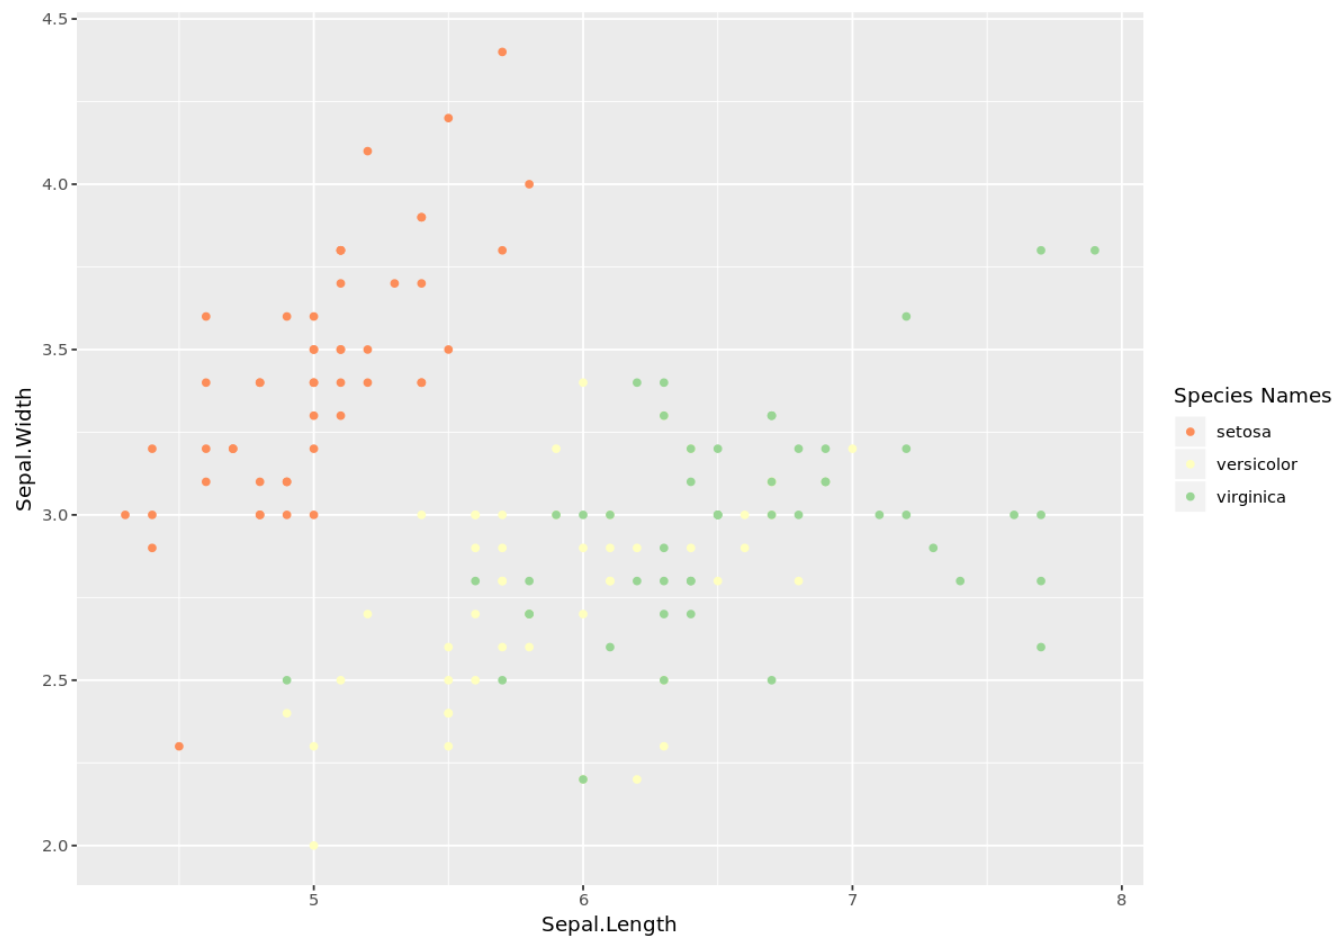
उदाहरण 3: कस्टम रंग स्केल का उपयोग करें
निम्नलिखित कोड दिखाता है कि RColorBrewer पैकेज से कस्टम रंग स्केल का उपयोग करके ggplot2 प्लॉट में बिंदुओं को कस्टम रंग कैसे निर्दिष्ट किया जाए:
 library (ggplot2)
library (RColorBrewer)

#define custom color scale
myColors <- brewer. pal (3, " Spectral ")
names(myColors) <- levels(iris$Species)
custom_colors <- scale_color_manual(name = " Species Names ", values = myColors)

ggplot(iris, aes (x=Sepal.Length, y=Sepal.Width, color=Species)) +
  geom_point() +
  custom_colors
अतिरिक्त संसाधन
Ggplot2 में साइड-बाय-साइड प्लॉट कैसे बनाएं
Ggplot2 में लेजेंड शीर्षक कैसे बदलें
सर्वोत्तम ggplot2 थीम के लिए एक संपूर्ण मार्गदर्शिका
लेखक के बारे में
डॉ. बेंजामिन एंडरसन
नमस्ते, मैं बेंजामिन हूं, एक सेवानिवृत्त सांख्यिकी प्रोफेसर जो अब समर्पित Statorials शिक्षक बन गया है। सांख्यिकी के क्षेत्र में व्यापक अनुभव और विशेषज्ञता के साथ, मैं Statorials के माध्यम से छात्रों को सशक्त बनाने के लिए अपना ज्ञान साझा करने के लिए उत्सुक हूं। अधिक जाने