Cara memplot distribusi chi-kuadrat dengan python
Untuk memplot distribusi Chi-kuadrat dengan Python, Anda dapat menggunakan sintaks berikut:
 #x-axis ranges from 0 to 20 with .001 steps
x = np. arange (0, 20, 0.001)

#plot Chi-square distribution with 4 degrees of freedom
plt. plot (x, chi2. pdf (x, df= 4 ))
Array x mendefinisikan rentang sumbu x dan plt.plot() menghasilkan plot distribusi chi-kuadrat dengan derajat kebebasan yang ditentukan.
Contoh berikut menunjukkan cara menggunakan fungsi-fungsi ini dalam praktik.
Contoh 1: Merencanakan Distribusi Chi-Kuadrat Tunggal
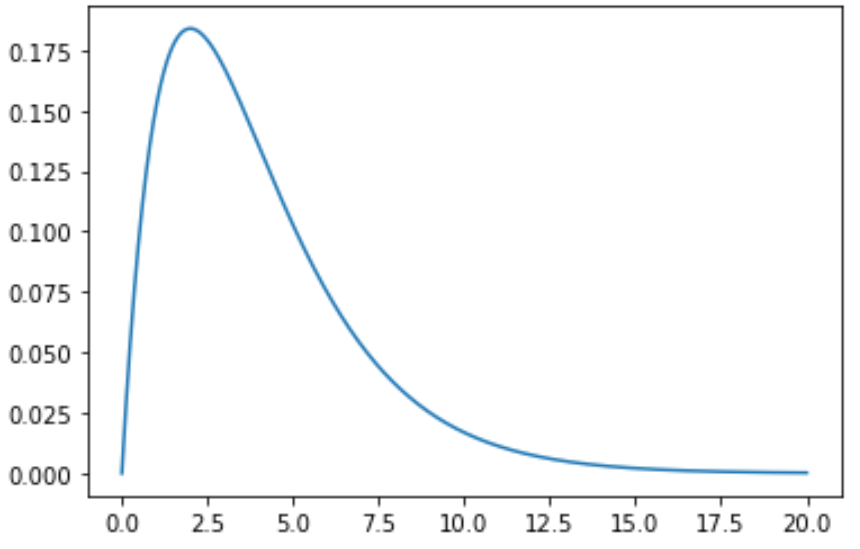
Kode berikut menunjukkan cara memplot kurva distribusi Chi-kuadrat tunggal dengan 4 derajat kebebasan
 import numpy as np
import matplotlib. pyplot as plt
from scipy. stats import chi2

#x-axis ranges from 0 to 20 with .001 steps
x = np. arange (0, 20, 0.001)

#plot Chi-square distribution with 4 degrees of freedom
plt. plot (x, chi2. pdf (x, df= 4 ))

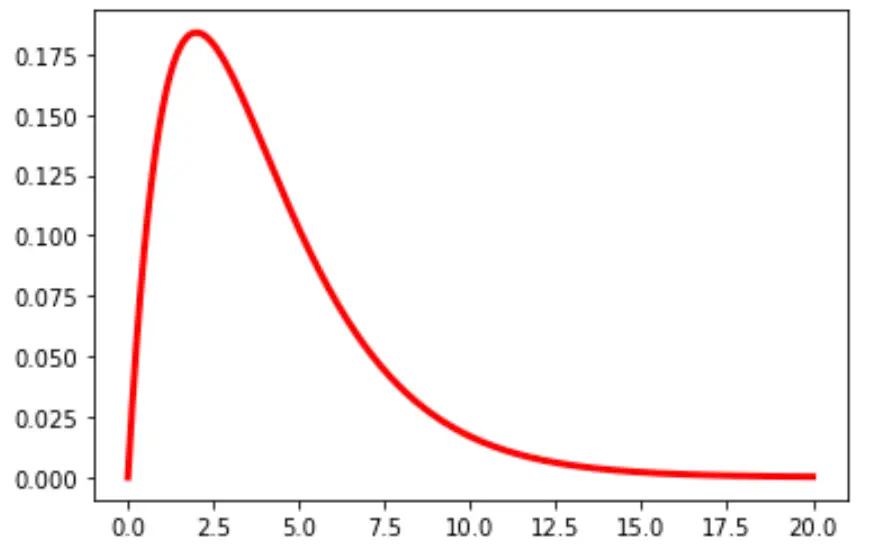
Anda juga dapat mengubah warna dan lebar garis pada grafik:
plt. plot (x, chi2. pdf (x, df= 4 ), color=' red ', linewidth= 3 )

Contoh 2: Merencanakan Beberapa Distribusi Chi-Kuadrat
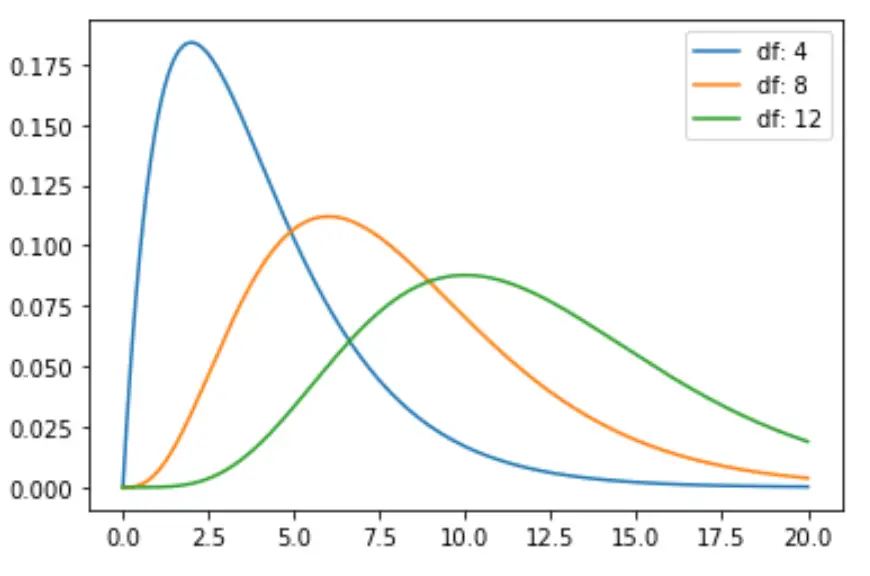
Kode berikut menunjukkan cara memplot beberapa kurva distribusi chi-kuadrat dengan derajat kebebasan berbeda:
 import numpy as np
import matplotlib. pyplot as plt
from scipy. stats import chi2

#x-axis ranges from 0 to 20 with .001 steps
x = np. arange (0, 20, 0.001)

#define multiple Chi-square distributions
plt. plot (x, chi2. pdf (x, df= 4 ), label=' df: 4 ')
plt. plot (x, chi2. pdf (x, df= 8 ), label=' df: 8 ')
plt. plot (x, chi2. pdf (x, df= 12 ), label=' df: 12 ')

#add legend to plot
plt. legend ()

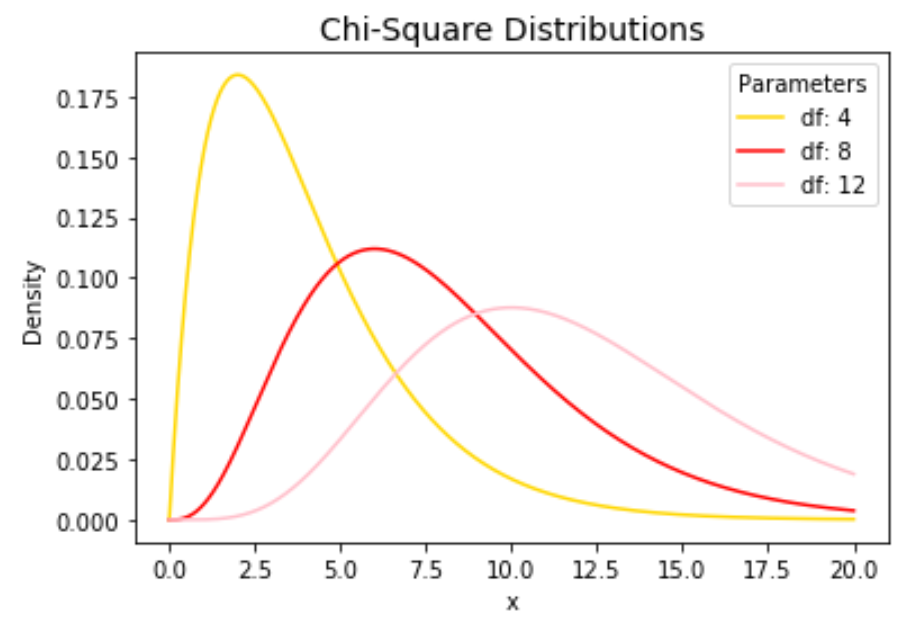
Jangan ragu untuk mengubah warna garis dan menambahkan judul dan label sumbu untuk melengkapi bagan:
 import numpy as np
import matplotlib. pyplot as plt
from scipy. stats import chi2

#x-axis ranges from 0 to 20 with .001 steps
x = np. arange (0, 20, 0.001)

#define multiple Chi-square distributions
plt. plot (x, chi2. pdf (x, df= 4 ), label=' df: 4 ', color=' gold ')
plt. plot (x, chi2. pdf (x, df= 8 ), label=' df: 8 ', color=' red ')
plt. plot (x, chi2. pdf (x, df= 12 ), label=' df: 12 ', color=' pink ')

#add legend to plot
plt. legend (title=' Parameters ')

#add axes labels and a title
plt. ylabel (' Density ')
plt. xlabel (' x ')
plt. title (' Chi-Square Distributions ', fontsize= 14 )

Lihat dokumentasi matplotlib untuk penjelasan detail tentang fungsi plt.plot() .