Cara membuat legenda manual di ggplot2 (dengan contoh)
Seringkali Anda mungkin ingin menambahkan legenda manual ke plot di ggplot2 dengan warna, label, judul khusus, dll.
Untungnya, hal ini mudah dilakukan menggunakan fungsi scale_color_manual() dan contoh berikut menunjukkan cara melakukannya.
Contoh: membuat legenda manual di ggplot2
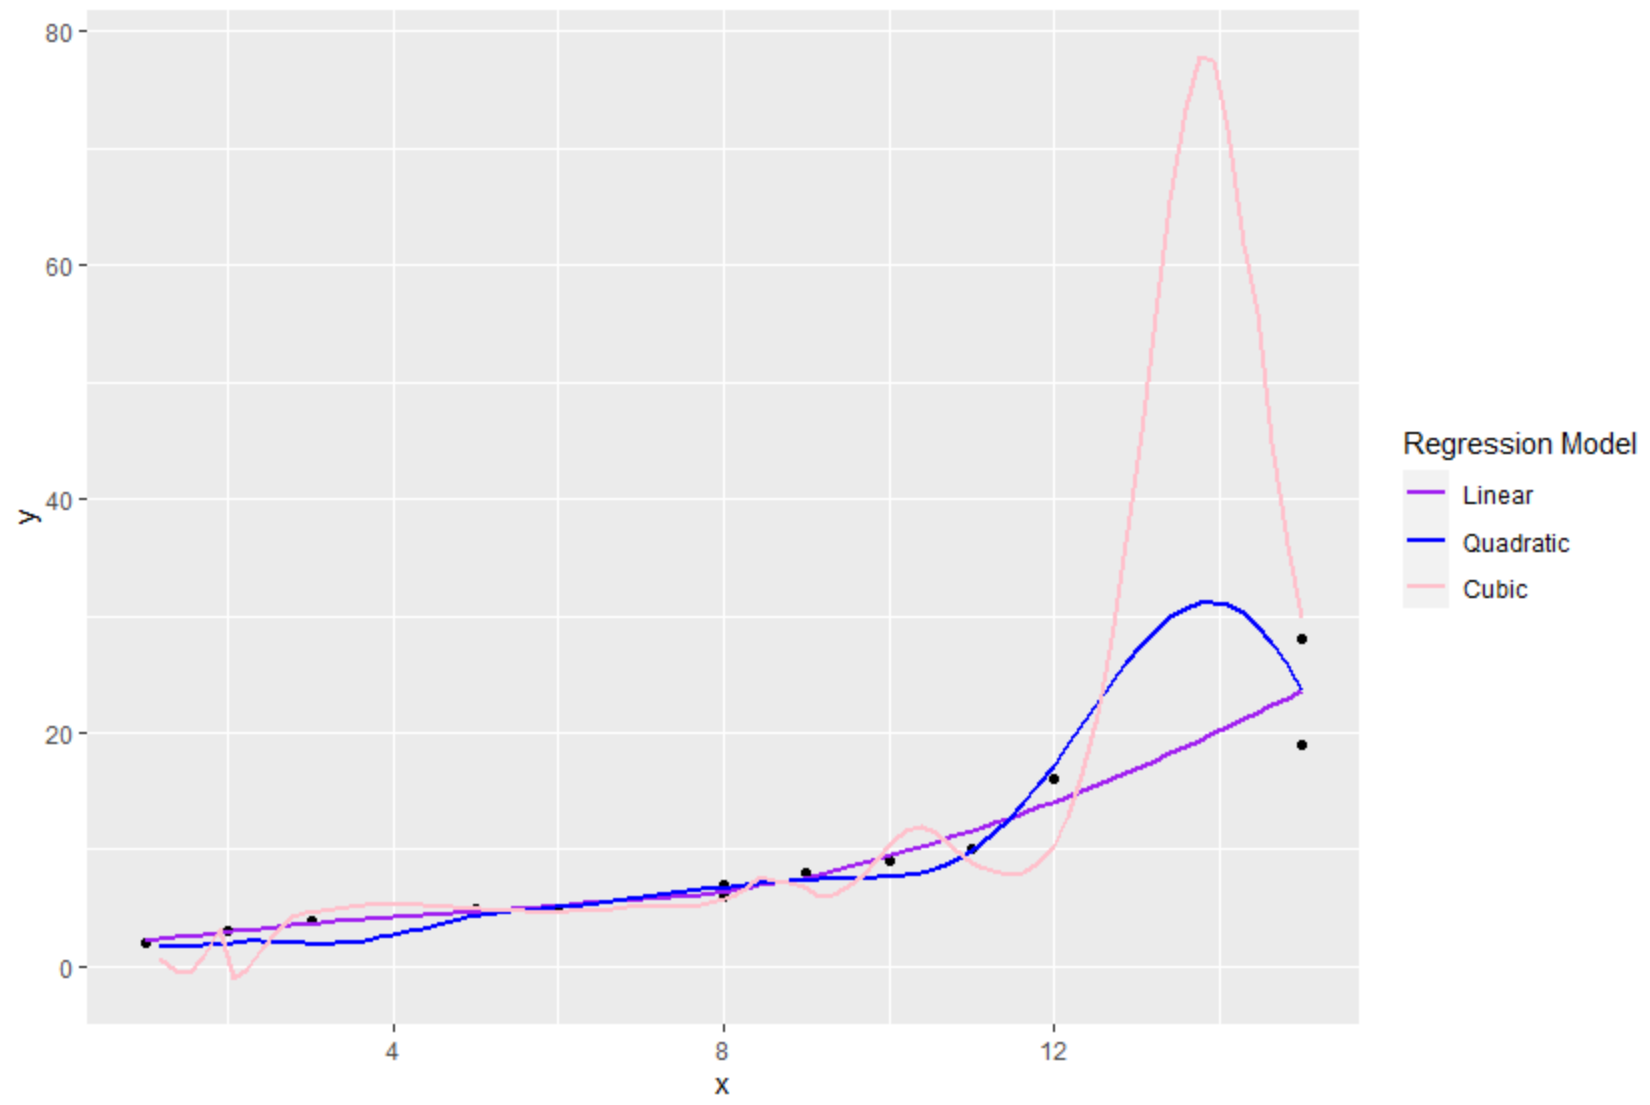
Kode berikut menunjukkan cara memplot tiga garis regresi yang dipasang di plot di ggplot2 dengan legenda manual khusus:
 library (ggplot2)

#create data frame
df <- data. frame (x=c(1, 2, 2, 3, 5, 6, 8, 8, 9, 9, 10, 11, 12, 15, 15),
                 y=c(2, 3, 3, 4, 5, 5, 6, 7, 8, 8, 9, 10, 16, 19, 28))

#create plot with three fitted regression models
ggplot(df, aes(x, y)) +
  geom_point() +
  geom_smooth(se= FALSE , aes(color=' Linear ')) +
  geom_smooth(formula=y~poly(x, 2), se= FALSE , aes(color=' Quadratic ')) +
  geom_smooth(formula=y~poly(x, 3), se= FALSE , aes(color=' Cubic ')) +
  scale_color_manual(name=' Regression Model ',
                     breaks=c(' Linear ', ' Quadratic ', ' Cubic '),
                     values=c(' Cubic '=' pink ', ' Quadratic '=' blue ', ' Linear '=' purple '))

Dengan menggunakan fungsi scale_color_manual() , kami dapat menentukan aspek legenda berikut:
- name : Judul legenda
- istirahat : Label dalam legenda
- nilai : Warna dalam legenda
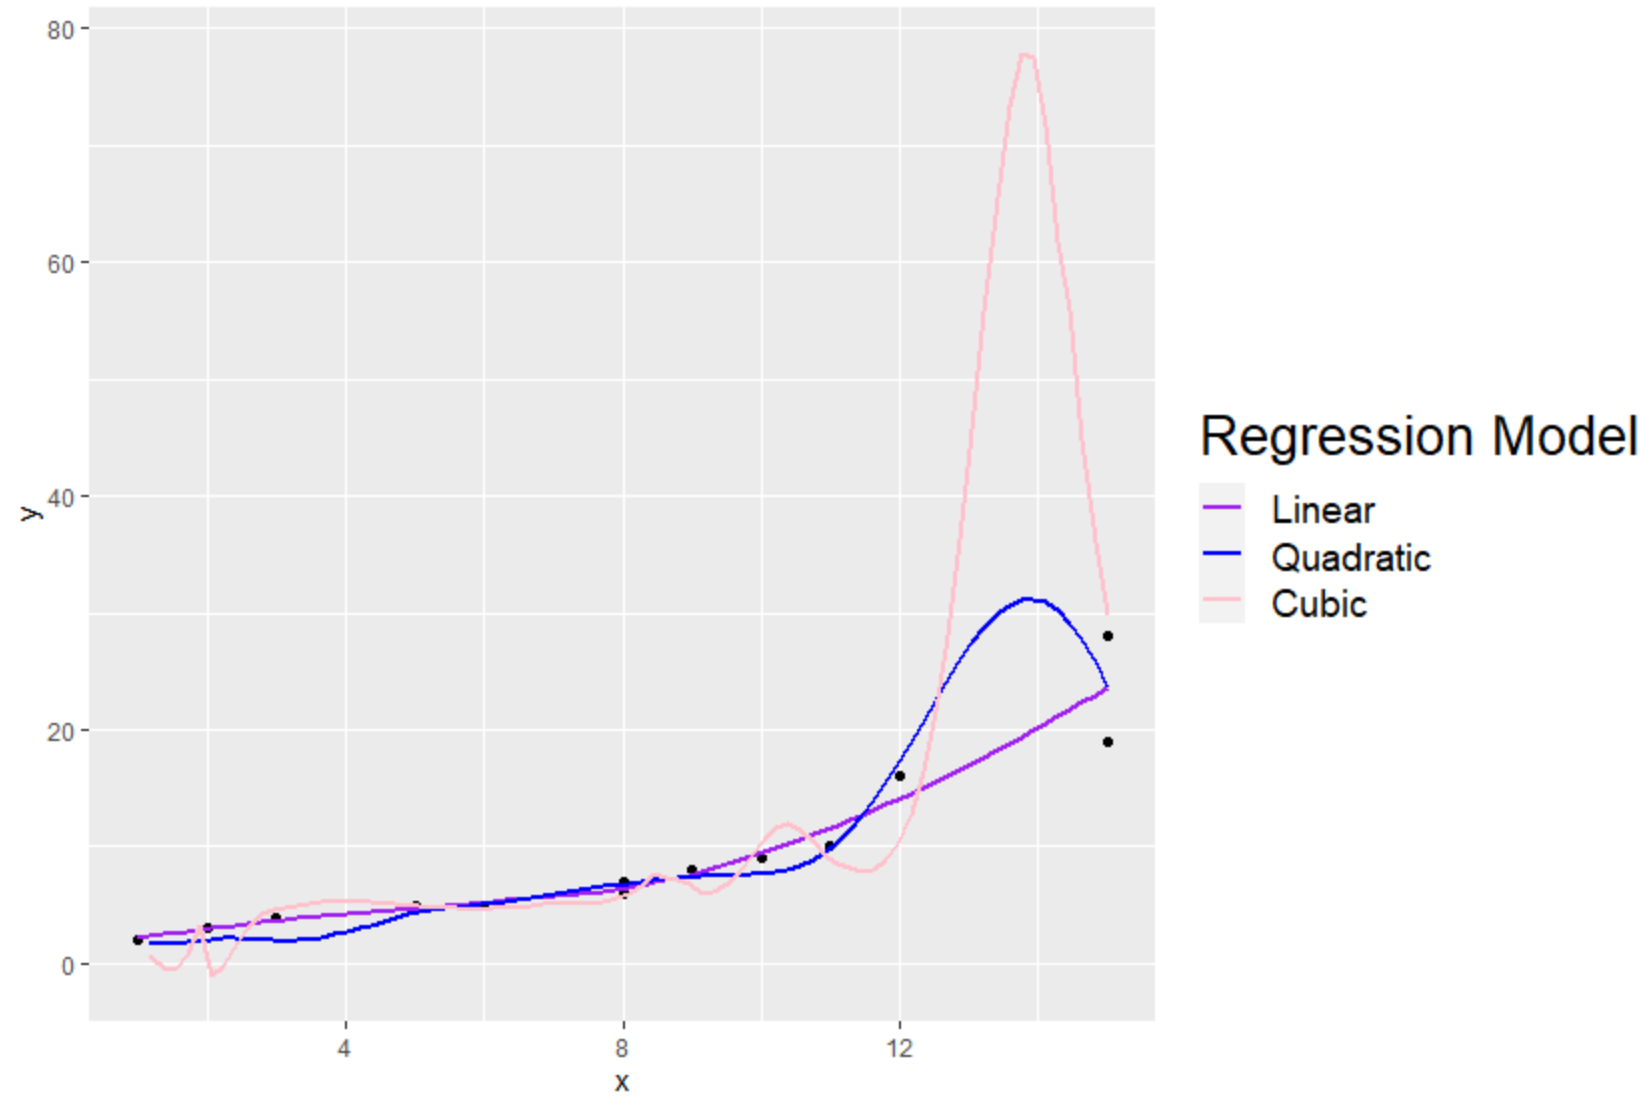
Perhatikan bahwa kita juga dapat menggunakan fungsi theme() untuk mengubah ukuran font elemen legenda:
 library (ggplot2)

#create data frame
df <- data. frame (x=c(1, 2, 2, 3, 5, 6, 8, 8, 9, 9, 10, 11, 12, 15, 15),
                 y=c(2, 3, 3, 4, 5, 5, 6, 7, 8, 8, 9, 10, 16, 19, 28))

#create plot with three fitted regression models
ggplot(df, aes(x, y)) +
  geom_point() +
  geom_smooth(se= FALSE , aes(color=' Linear ')) +
  geom_smooth(formula=y~poly(x, 2), se= FALSE , aes(color=' Quadratic ')) +
  geom_smooth(formula=y~poly(x, 3), se= FALSE , aes(color=' Cubic ')) +
  scale_color_manual(name=' Regression Model ',
                     breaks=c(' Linear ', ' Quadratic ', ' Cubic '),
                     values=c(' Cubic '=' pink ', ' Quadratic '=' blue ', ' Linear '=' purple '))+
 theme(legend. title =element_text(size= 20 ),
       legend. text =element_text(size= 14 ))

Perhatikan bahwa ukuran font judul dan label keterangan telah ditingkatkan.
Sumber daya tambahan
Tutorial berikut menjelaskan cara melakukan operasi umum lainnya di ggplot2:
Bagaimana cara mengubah posisi legenda di ggplot2
Cara mengubah ukuran legenda di ggplot2
Bagaimana cara mengubah judul legenda di ggplot2
Cara mengubah label legenda di ggplot2