Cara membuat plot deret waktu di matplotlib (dengan contoh)
Anda dapat menggunakan sintaks berikut untuk memplot deret waktu di Matplotlib:
 import matplotlib. pyplot as plt

plt. plot (df. x , df. y )
Ini mengasumsikan bahwa variabel x termasuk dalam kelas datetime.datetime() .
Contoh berikut menunjukkan cara menggunakan sintaks ini untuk memplot data deret waktu dengan Python.
Contoh 1: Plot deret waktu dasar di Matplotlib
Kode berikut menunjukkan cara memplot deret waktu di Matplotlib yang menunjukkan total penjualan yang dilakukan oleh bisnis selama 12 hari berturut-turut:
 import matplotlib. pyplot as plt
import datetime
import numpy as np
import pandas as pd

#define data
df = pd. DataFrame ({' date ': np. array ([datetime. datetime (2020, 1, i+1)
for i in range(12)]),
                   ' sales ': [3, 4, 4, 7, 8, 9, 14, 17, 12, 8, 8, 13]})

#plot time series
plt. plot (df. date , df. sales , linewidth= 3 )
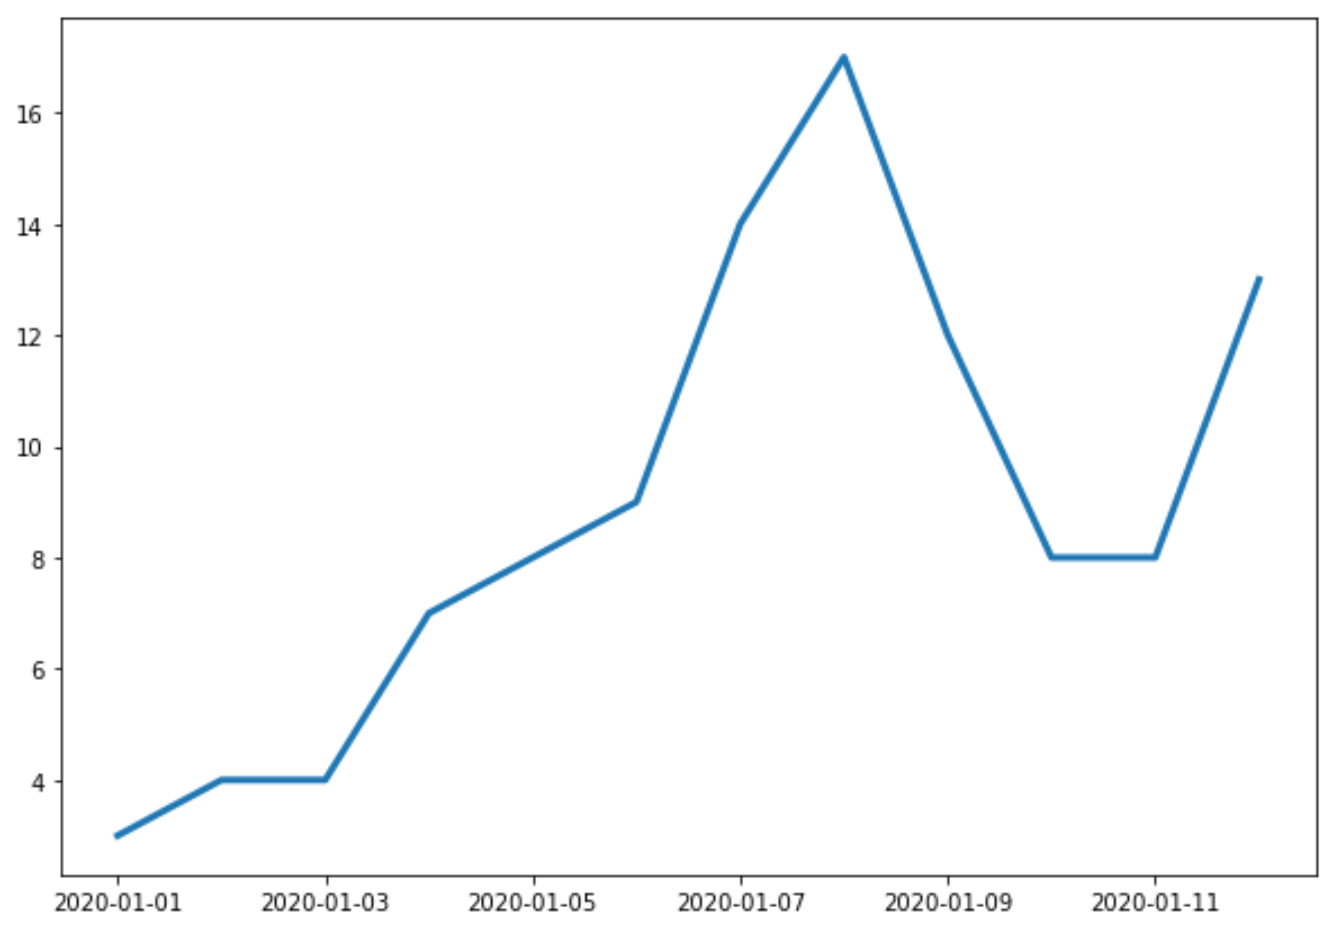
Sumbu X menunjukkan tanggal dan sumbu Y menunjukkan total penjualan pada setiap tanggal.
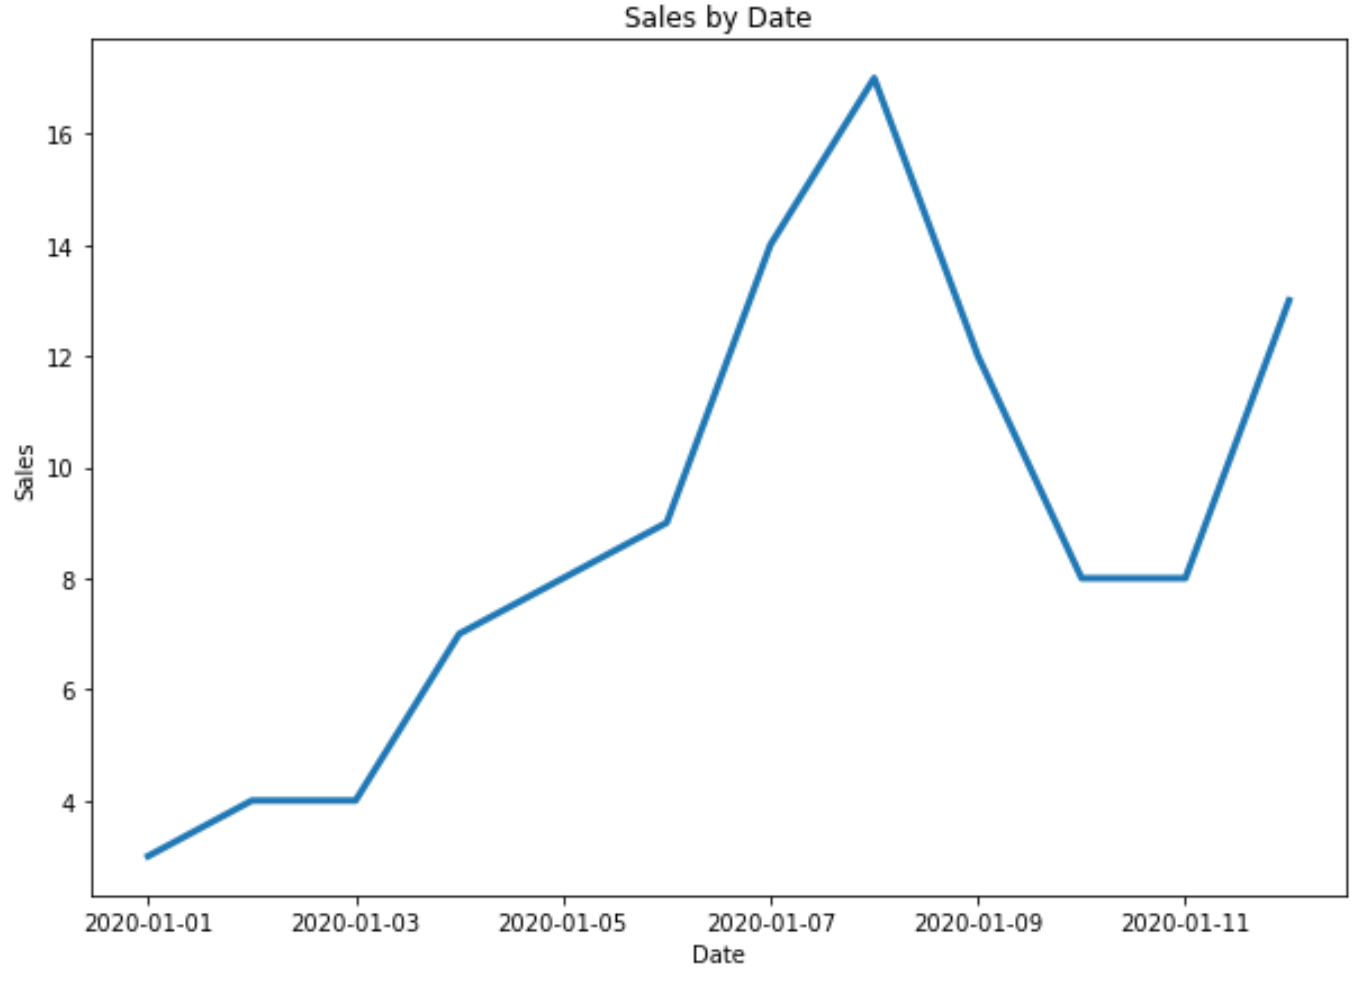
Contoh 2: Sesuaikan label judul dan sumbu
Anda dapat menggunakan kode berikut untuk menambahkan judul dan label sumbu ke plot:
 import matplotlib. pyplot as plt
import datetime
import numpy as np
import pandas as pd

#define data
df = pd. DataFrame ({' date ': np. array ([datetime. datetime (2020, 1, i+1)
for i in range(12)]),
                   ' sales ': [3, 4, 4, 7, 8, 9, 14, 17, 12, 8, 8, 13]})

#plot time series
plt. plot (df. date , df. sales , linewidth= 3 )

#add title and axis labels
plt. title (' Sales by Date ')
plt. xlabel (' Date ')
plt. ylabel (' Sales ')
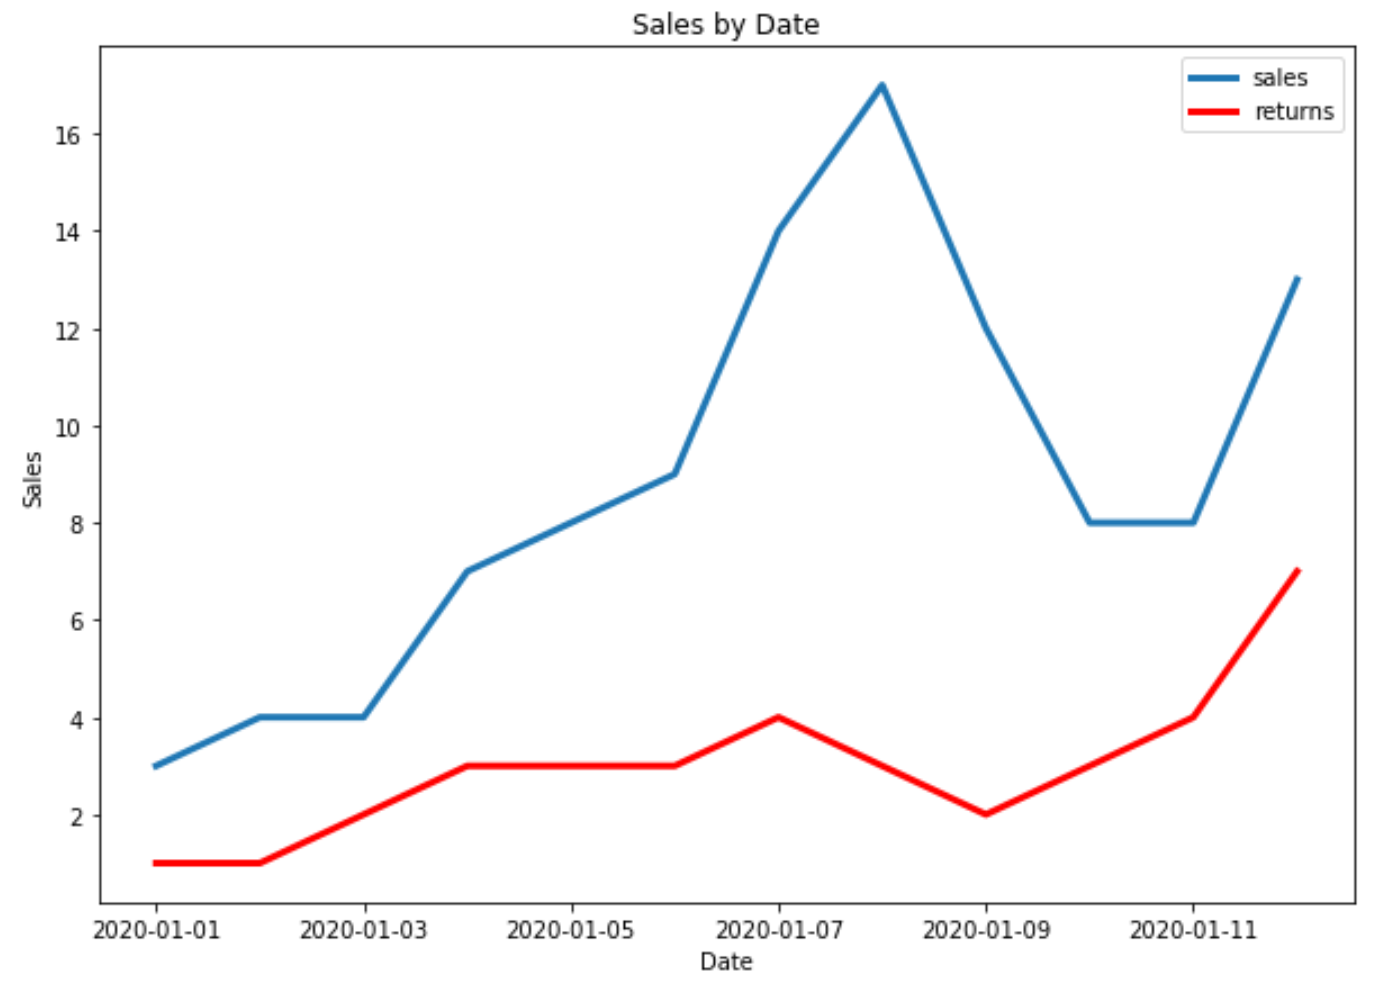
Contoh 3: Plot beberapa deret waktu di Matplotlib
Kode berikut menunjukkan cara memplot beberapa deret waktu dalam satu plot di Matplotlib:
 import matplotlib. pyplot as plt
import datetime
import numpy as np
import pandas as pd

#define data
df = pd. DataFrame ({' date ': np. array ([datetime. datetime (2020, 1, i+1)
                                     for i in range(12)]),
                   ' sales ': [3, 4, 4, 7, 8, 9, 14, 17, 12, 8, 8, 13]})

df2 = pd. DataFrame ({' date ': np. array ([datetime. datetime (2020, 1, i+1)
                                      for i in range(12)]),
                   ' returns ': [1, 1, 2, 3, 3, 3, 4, 3, 2, 3, 4, 7]})

#plot both time series
plt. plot ( df.date , df.sales , label=' sales ', linewidth= 3 )
plt. plot ( df2.date , df2.returns , color=' red ', label=' returns ', linewidth= 3 )

#add title and axis labels
plt. title (' Sales by Date ')
plt. xlabel (' Date ')
plt. ylabel (' Sales ')

#add legend
plt. legend ()

#displayplot
plt. show ()
Sumber daya tambahan
Matplotlib: Cara membuat plot kotak berdasarkan grup
Matplotlib: Cara Membuat Diagram Batang Bertumpuk
Tentang Penulis
Benjamin anderson
Halo, saya Benjamin, pensiunan profesor statistika yang menjadi guru Statorial yang berdedikasi. Dengan pengalaman dan keahlian yang luas di bidang statistika, saya ingin berbagi ilmu untuk memberdayakan mahasiswa melalui Statorials. Baca selengkapnya